Someone has set up a petition on change.org to increase the speed limit on PA 550 to 55 m.p.h. The petition states:
“The speed limit on PA route 550 south is too low and should be increased to 55mph. A large portion of motorists already consistently drive over 50mph on 550 daily and by increasing the speed limit the road would be made safer as the speed limit would more closely resemble the speed motorists actually travel on the road. This would also likely eliminate most tailgating and strings of traffic behind someone going ‘exactly 45 THE WHOLE WAY DOWN 550.’”
As of this posting, 22 people have signed the petition.
PA 550 is a rural highway that runs from Zion, PA to near Tyrone, PA. The petition does not state which section of the highway it is addressing, or mention that the current posted speed limits are not consistent along its length (35 m.p.h. in Stormstown, 25 m.p.h. in Bellefonte, and above 45 in Huntingdon County). Nor does it mention the no passing zones for much of its length, the limited sight distances, sharp curves, the presence of slow moving farm equipment, or wildlife crossing the highway.
The argument stated in the petition is a logical fallacy. Just because “everyone” is exceeding the speed limit is not a valid argument for increasing it. As stated above there are too many potential hazards to warrant an increase to 55 mph.
July was 0.4 deg F below normal for temperature. The high for the month was 91.8 deg. F recorded on July 7. The low for the month was 49.6 deg F, recorded on July 31. There was a single day at or above 90 deg F! There were 32 heating degree days and 224 cooling degree days.
July was a below normal month for precipitation with 3.08 inches of rainfall recorded, which was 0.38 inches below normal. The maximum rainfall in a single day was 0.69 inches recorded on July 7. There were 12 days of rain >.01 in, 7 >.10 in and 0 >1 in.
June was 1.0 deg F above normal for temperature. The high for the month was 92 deg. F recorded on June 29. The low for the month was 41 deg F, recorded on June 23. There were 63 heating degree days and 188 cooling degree days.
June was an above normal month for precipitation with 6.42 inches of rainfall recorded, which was 2.56 inches above normal. The maximum rainfall in a single day was 1.65 inches recorded on June 13. There were 13 days of rain >.01 in, 10 >.10 in and 2 >1 in.
High wind speed of 44 mph on June 21. The high winds caused tree damage in the area.
Damaged Trees Blocking PA 550 near Patton/Halfmoon Township Line June 21, 2021 – Photo by George Riley
March was 5.3 deg F above normal for temperature. The high for the month was 69.9 deg. F, recorded on March 25. The low for the month was 13.7 deg F, recorded on March 7. There was 1 day where the maximum temperature was at or below 32 F, and there were 20 days where the minimum temperature was at or below 32 F. There were 697 heating degree days and 1 cooling degree day.
March was a below normal month for precipitation with 2.96 inches of rainfall recorded, which was 0.86 inches below normal. The maximum rainfall in a single day was 0.87 inches recorded on March 18. There were 9 days of rain >.01 in, 6 >.10 in and 0 > 1 in.
February was 1.2 deg F below normal for temperature. The high for the month was 58.1 deg. F, recorded on February 24. The low for the month was 2.8 deg F, recorded on February 8. There were 14 days when the maximum was at or below 32 F and 26 days when the minimum temperature was at or below 32 F. There were 1031 heating degree days and 0 cooling degree days.
Due to the ice and snow accumulation, which fouled the electronic rain gauge, precipitation data was collected from a nearby CoCoRaHS (PA-CN-18) station. February was an above-normal month for precipitation with 2.52 inches of rainfall recorded, which was 0.25 inches above normal. The maximum rainfall in a single day was 0.68 inches recorded on February 16. There were 18 days of rain >.01 in, 9 >.10 in and 0 > 1 in.
There were 28.3 inches of snow for the month, with a maximum daily total of 6.4 inches on February 1. The 3-day total recorded on February 1-3 was 14.9 inches.
Due to the epically failed Climate Prediction Center outlooks for February 2021, they will no longer be published here. They can be viewed with the following URL:
January started with freezing rain on the first. On, January 3, I measured 3″ of snow. There was more freezing rain on January 26. On January 31, 2 inches of snow had fallen with more to come.
January was 2.6 deg F above normal for temperature. The high for the month was 48.4 deg. F, recorded on January 14. The low for the month was 12.6 deg F, recorded on January 21. There were 30 days at or below 32 F and 5 days when the maximum temperature was at or below 32 F. There were 1064 heating degree days and 0 cooling degree days.
January was a below-normal month for precipitation with 1.05 inches of rainfall recorded, which was 2.06 inches below normal. The maximum rainfall in a single day was 0.36 inches recorded on January 15. There were 12 days of rain >.01 in, 3 >.10 in and 0 > 1 in.
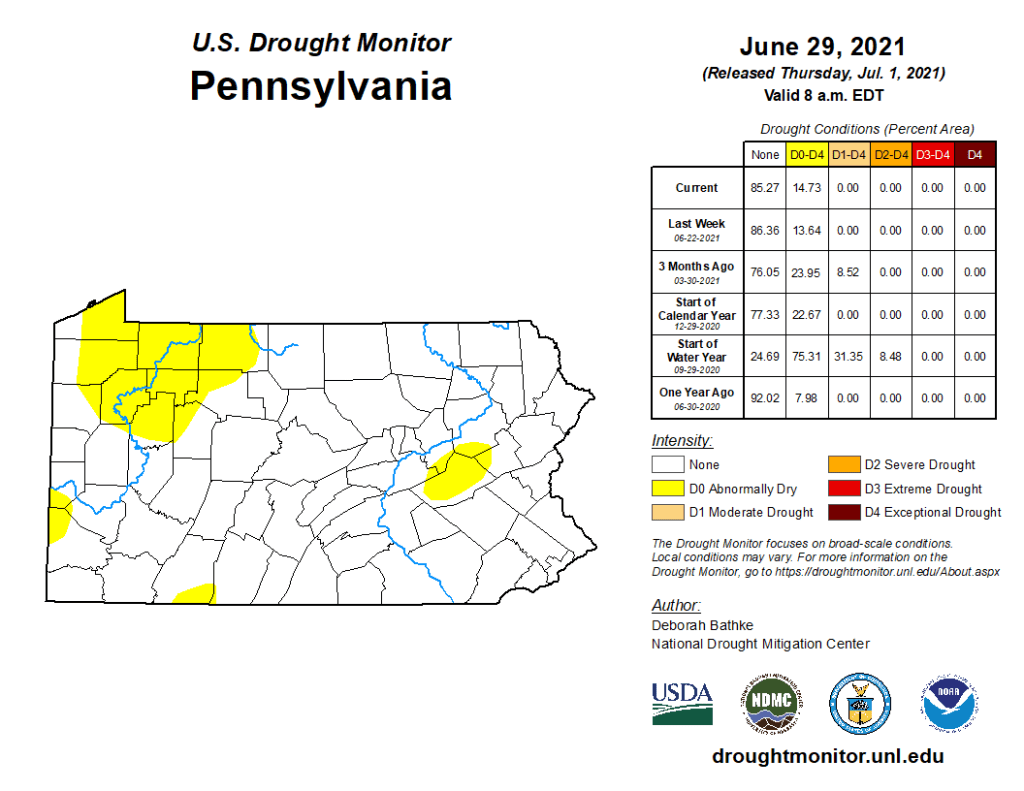
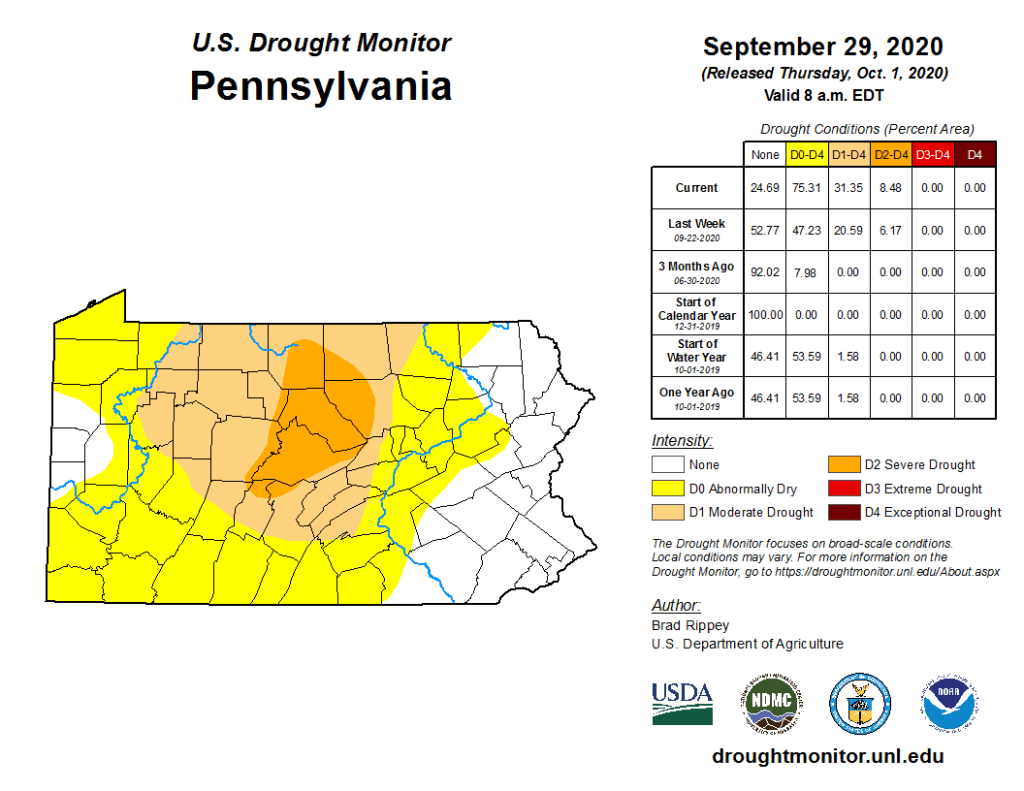
Overall, the year’s temperatures were above normal. The annual mean of 52.1 F was 2.0 F above normal. Of course the main event of 2020 was the drought. The annual precipitation of 36.46 inches was 4.24 inches below normal. Most of Centre County was in a severe drought in September.
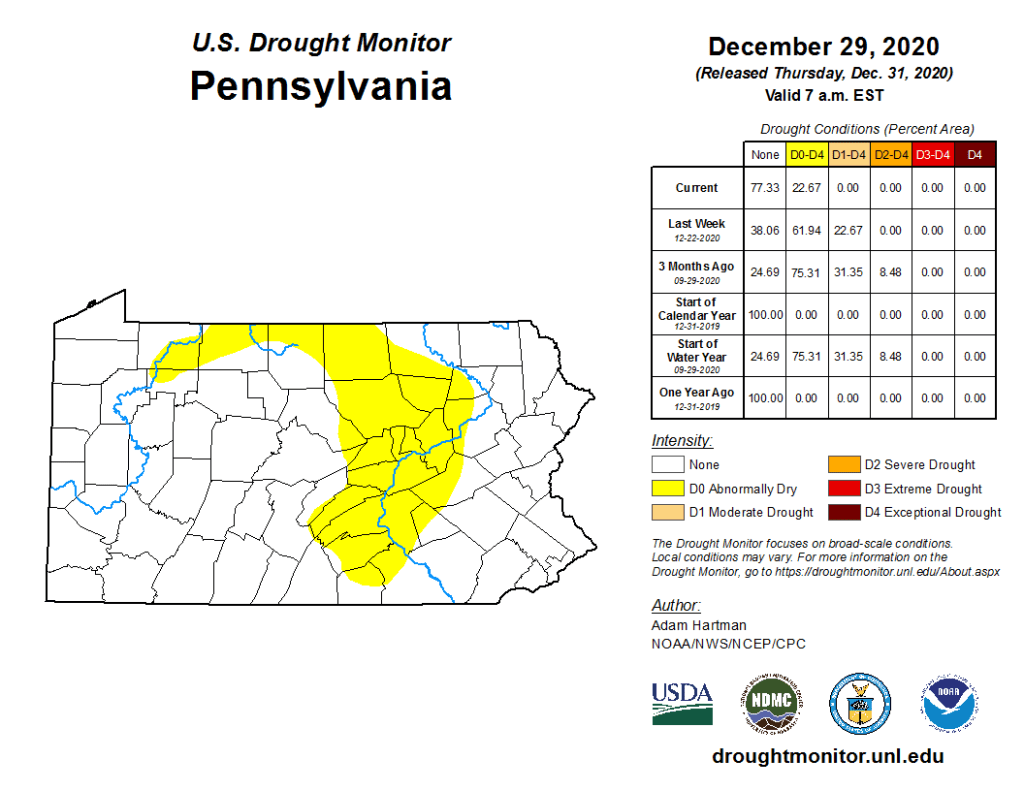
However, at the end of the year, the drought in Centre County was essentially over.
2020 Weather Data
January
Snowfall on January 7, 2020
January was mild with a monthly mean of 33.2 F, which was 5.1 F above normal, with a high of 64 F and a low for the month of 9 F. Precipitation was 1.07 inches below normal with 2.04 inches of liquid precipitation.
February
The mild winter continued into February which was 5.5 F above normal. The high was 62 F and the low was 6 F, which was also the low for the year. Precipitation was 0.60 inches above normal at 2.87 inches.
March
Dusting of snow on Bald Eagle Ridge on March 15, 2020
March temperatures were also mild at 6.0 F above normal with a high of 73 F and a low of 22 F. Precipitation was 1.71 inches above normal with 5.26 inches of liquid precipitation. The high wind speed for the month and year was 47 mph.
April
Dusting of snow on Bald Eagle Ridge on April 18, 2020
Temperatures were 3.1 F below normal in April. The high was 70 F and the low was 24 F. Rainfall was 1.67 inches above normal at 5.06 inches.
May
Spring did finally arrive in mid-May. Bald Eagle Ridge on May 31, 2020
Spring temperatures continued to be cooler than normal in spite of a mild March. May was 2 F below normal with a high of 86 F and a low of 27 F. Precipitation was 1.72 inches which was 1.51 inches below normal. This was perhaps the harbinger of the future drought conditions. The last day of temperatures below freezing was May 13.
June
Temperatures for the month were near normal. The high was 88 F and the low was 41 F. Precipitation was 0.94 inches above normal with 4.80 inches of rainfall.
July
July was the warmest month of the year. The temperatures were 3 F above normal. The high for the month and year was 95 F and the low was 55 F. Rainfall was 2.27 inches below normal with 1.19 inches of precipitation.
July also gave us outstanding views of Comet Neowise.
Comet Neowise from Stormstown, PA
August
Forest fires in the western U.S. provided spectacular sunsets. August 15, 2020
The month’s temperatures were 2 F above normal. The high was 93 F and the low was 47 F. Precipitation was 2.66 inches below normal at 3.42 inches. The drought was getting severe.
September
Hazy sunset due to the western forest fires. September 22, 2020
Temperatures were near normal this month. The high was 86 F and the low was 32 F. Drought conditions continued with 2.61 inches of rainfall. This was 1.37 inches below normal. The first freeze of the season was September 20.
October
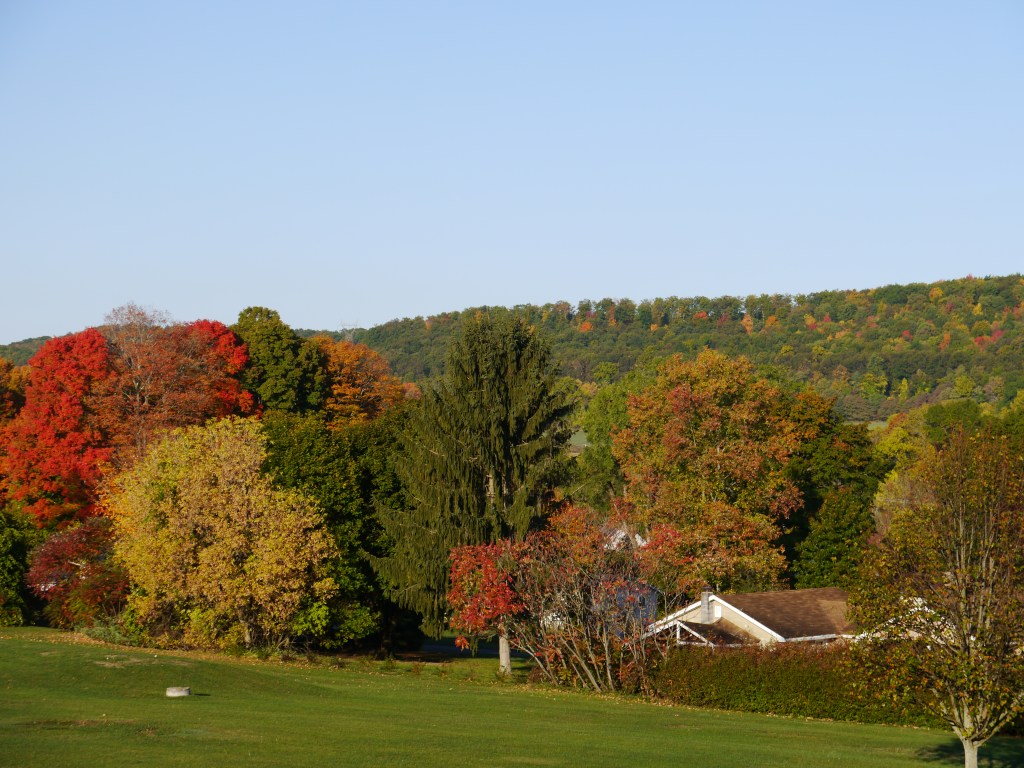
Fall foliage, Sormstown, October 9, 2020
October was warmer at 1.0 F above normal. The high was 81 F and the low was 28 F. Rainfall was below normal at 2.96 inches, which was 0.38 inches below normal.
November
Temperatures were mild in November and were 3.7 F above normal. The high was 76 F and the low was 22 F. Precipitation was 3.44 inches, 0.20 inches above normal.
December
December was the coldest month of 2020. The mean temperature was 32.6 F. The temperatures were 0.8 F above normal. The high was 55 F and the low was 11 F. Precipitation was 0.10 inches below normal at 1.88 inches.
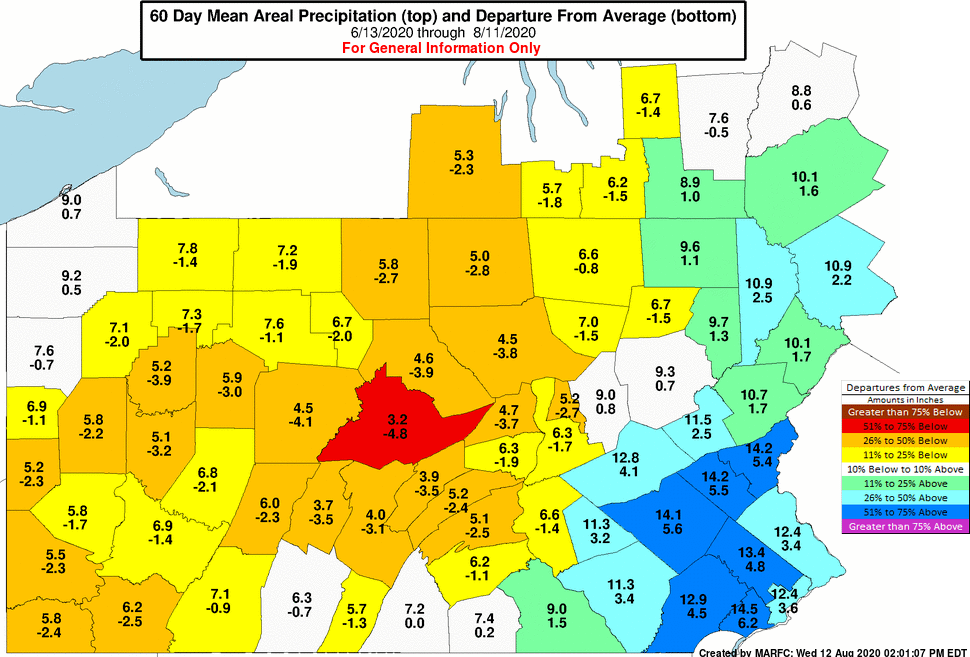
The following was recently posted by the State College National Weather Service Office. The chart was produced by The Mid-Atlantic River Forecast Center (MARFC) which is co-located with The State College National Weather Service Forecast Office.
A neighbor asked to explain why Centre County was depicted as being a standout from the other counties.
For the 60-day period (6/13/2020 through 8/11/2020) Centre County’s areal precipitation was 3.2 inches which was 4.8 inches below normal for the period. A normal amount would have been 8 inches. This works out to be 60% below normal which is above the 50% threshold for the red portion of the scale. By comparison, here are the values for the surrounding counties: Blair 47%, Cambria 29%, Clearfield 47%, Clinton 41%, Huntington 43%, Mifflin 47%, Snyder 44%.
The River Forecast Centers use a distance weighting technique to calculate the areal precipitation. A grid of point estimates is made based on a distance weighting scheme. Each observed point value is given a unique weight for each grid point based on the distance from the grid point in question. The grid point precipitation value is calculated based on the sum of the individual station weight multiplied by observed station value. Once the grid points have all been estimated they are summed and the sum is divided by the number of grid points to obtain the areal average precipitation.
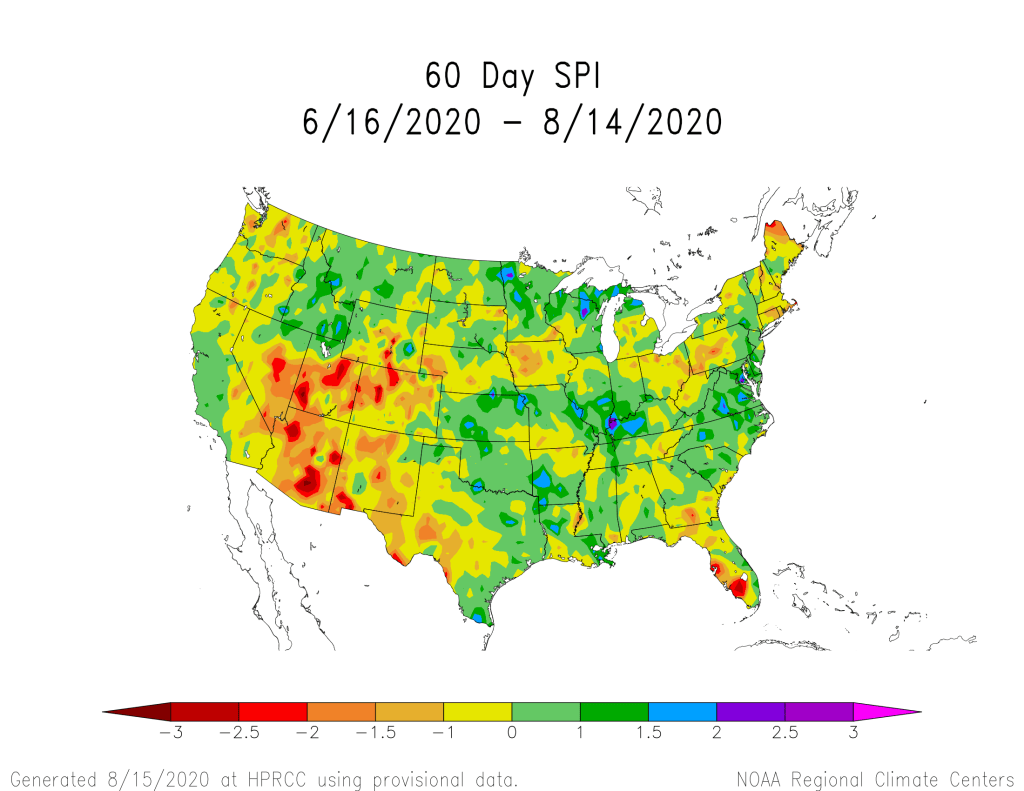
Here is a map of standardized precipitation index (SPI).
There is a bullseye of values between -2 and -1.5 over our region.
The SPI is a widely used index to characterize meteorological drought on a range of timescales. On short timescales, the SPI is closely related to soil moisture, while at longer timescales, the SPI can be related to groundwater and reservoir storage. The SPI uses precipitation only, and can characterize drought or abnormal wetness at different time scales which correspond with the time availability of different water resources (e.g. soil moisture, snowpack, groundwater, river discharge and reservoir storage).
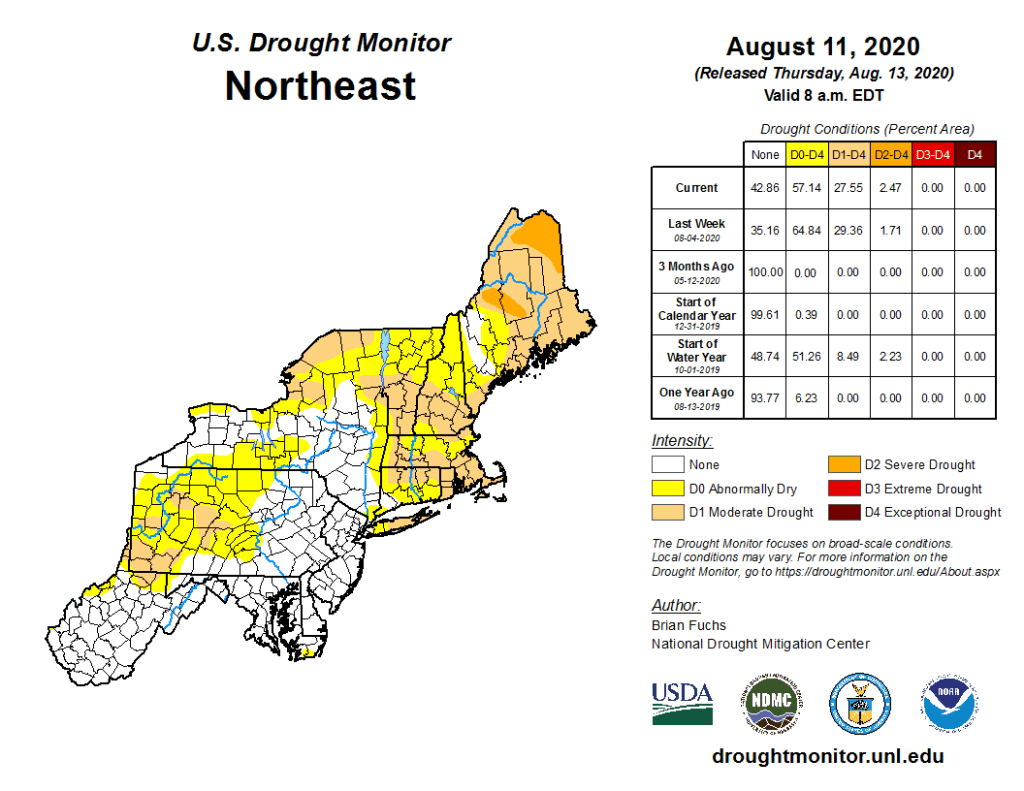
Drought for the Northeast United States
As the above map indicates, southwestern Centre County is experiencing a moderate drought. The criteria for drought classification appears below.
July was lower than normal for precipitation for six counties in central Pennsylvania.
Pennsylvania July 2020 Precipitation by County
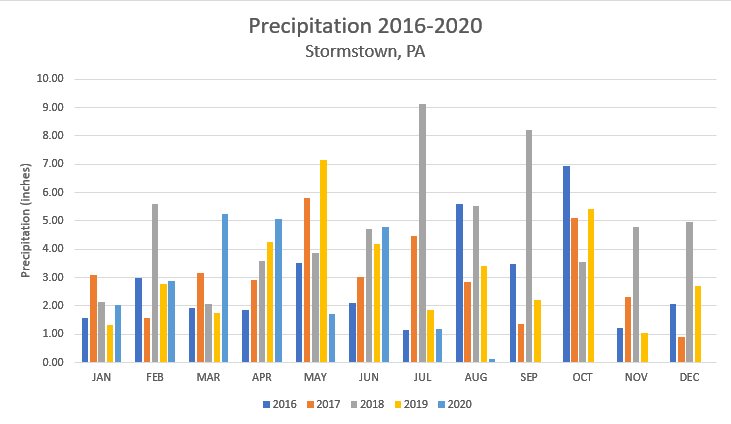
The above graph shows all of the precipitation data I have collected since establishing my weather station in December 2015 until now. This past July was as dry as July 2016. However, August 2020 is on track to be the driest in 5 years.