The village that is now called Stormstown was located on one of the area’s earliest roads. Laid out in 1791-92, the road served as a main route for the shipment of Centre County iron west to Pittsburgh. First settler Abraham Elder’s tavern, on the east end of the village, was a stopping place for iron haulers. In 1812 David Storm recorded a plat of 30 lots, plus a school lot, that he named Walkerville, on the west side of present-day Municipal Lane in the middle of Stormstown. The origin of the Walker connection has not yet been tracked down. Some twenty years after Walkerville was established, Caleb Way slowly started selling off lots between Walkerville and the former site of Elder’ tavern, in an area that was briefly called Wayville. Eventually, by the time of the Civil War, the whole area was called Stormstown. The enterprises of the village included a gristmill, sawmill, distillery, tannery, wagon maker, and several craftsmen’s shops – blacksmith, weaver, potter, and chairmaker.
On April 7, 1867, an Easter fire destroyed twenty-six buildings, many of which were never rebuilt. The fire started in George Matters house and in less than three hours, the entire portion of the town lying between the Port Matilda Road and Capt. Hunter’s residence, 2/3 of Stormstown was destroyed by fire. In addition to these losses, all the stables and outhouses on the south side of the street and east of the road to Pine Grove Mills were destroyed.
January was 3.7°F below normal for temperature. The highest temperature of the month was 54.9 F, recorded on January 9. The low for the month was -3.7 deg F, recorded on January 22. There were 17 days when the maximum was at or below 32 F, 27 days when the minimum temperature was at or below 32 F, and 3 days when the minimum temperature was at or below 0 F. There were 1281 heating degree days and 0 cooling degree days.
January was a below-normal month for precipitation, with 2.29 inches of liquid precipitation recorded, which was 0.63 inches below normal. The maximum liquid precipitation in a single day was 0.47 inches, recorded on January 31. There were 7 days of rain >.01 in, 4 >.10 in, and 1 > 1 in.
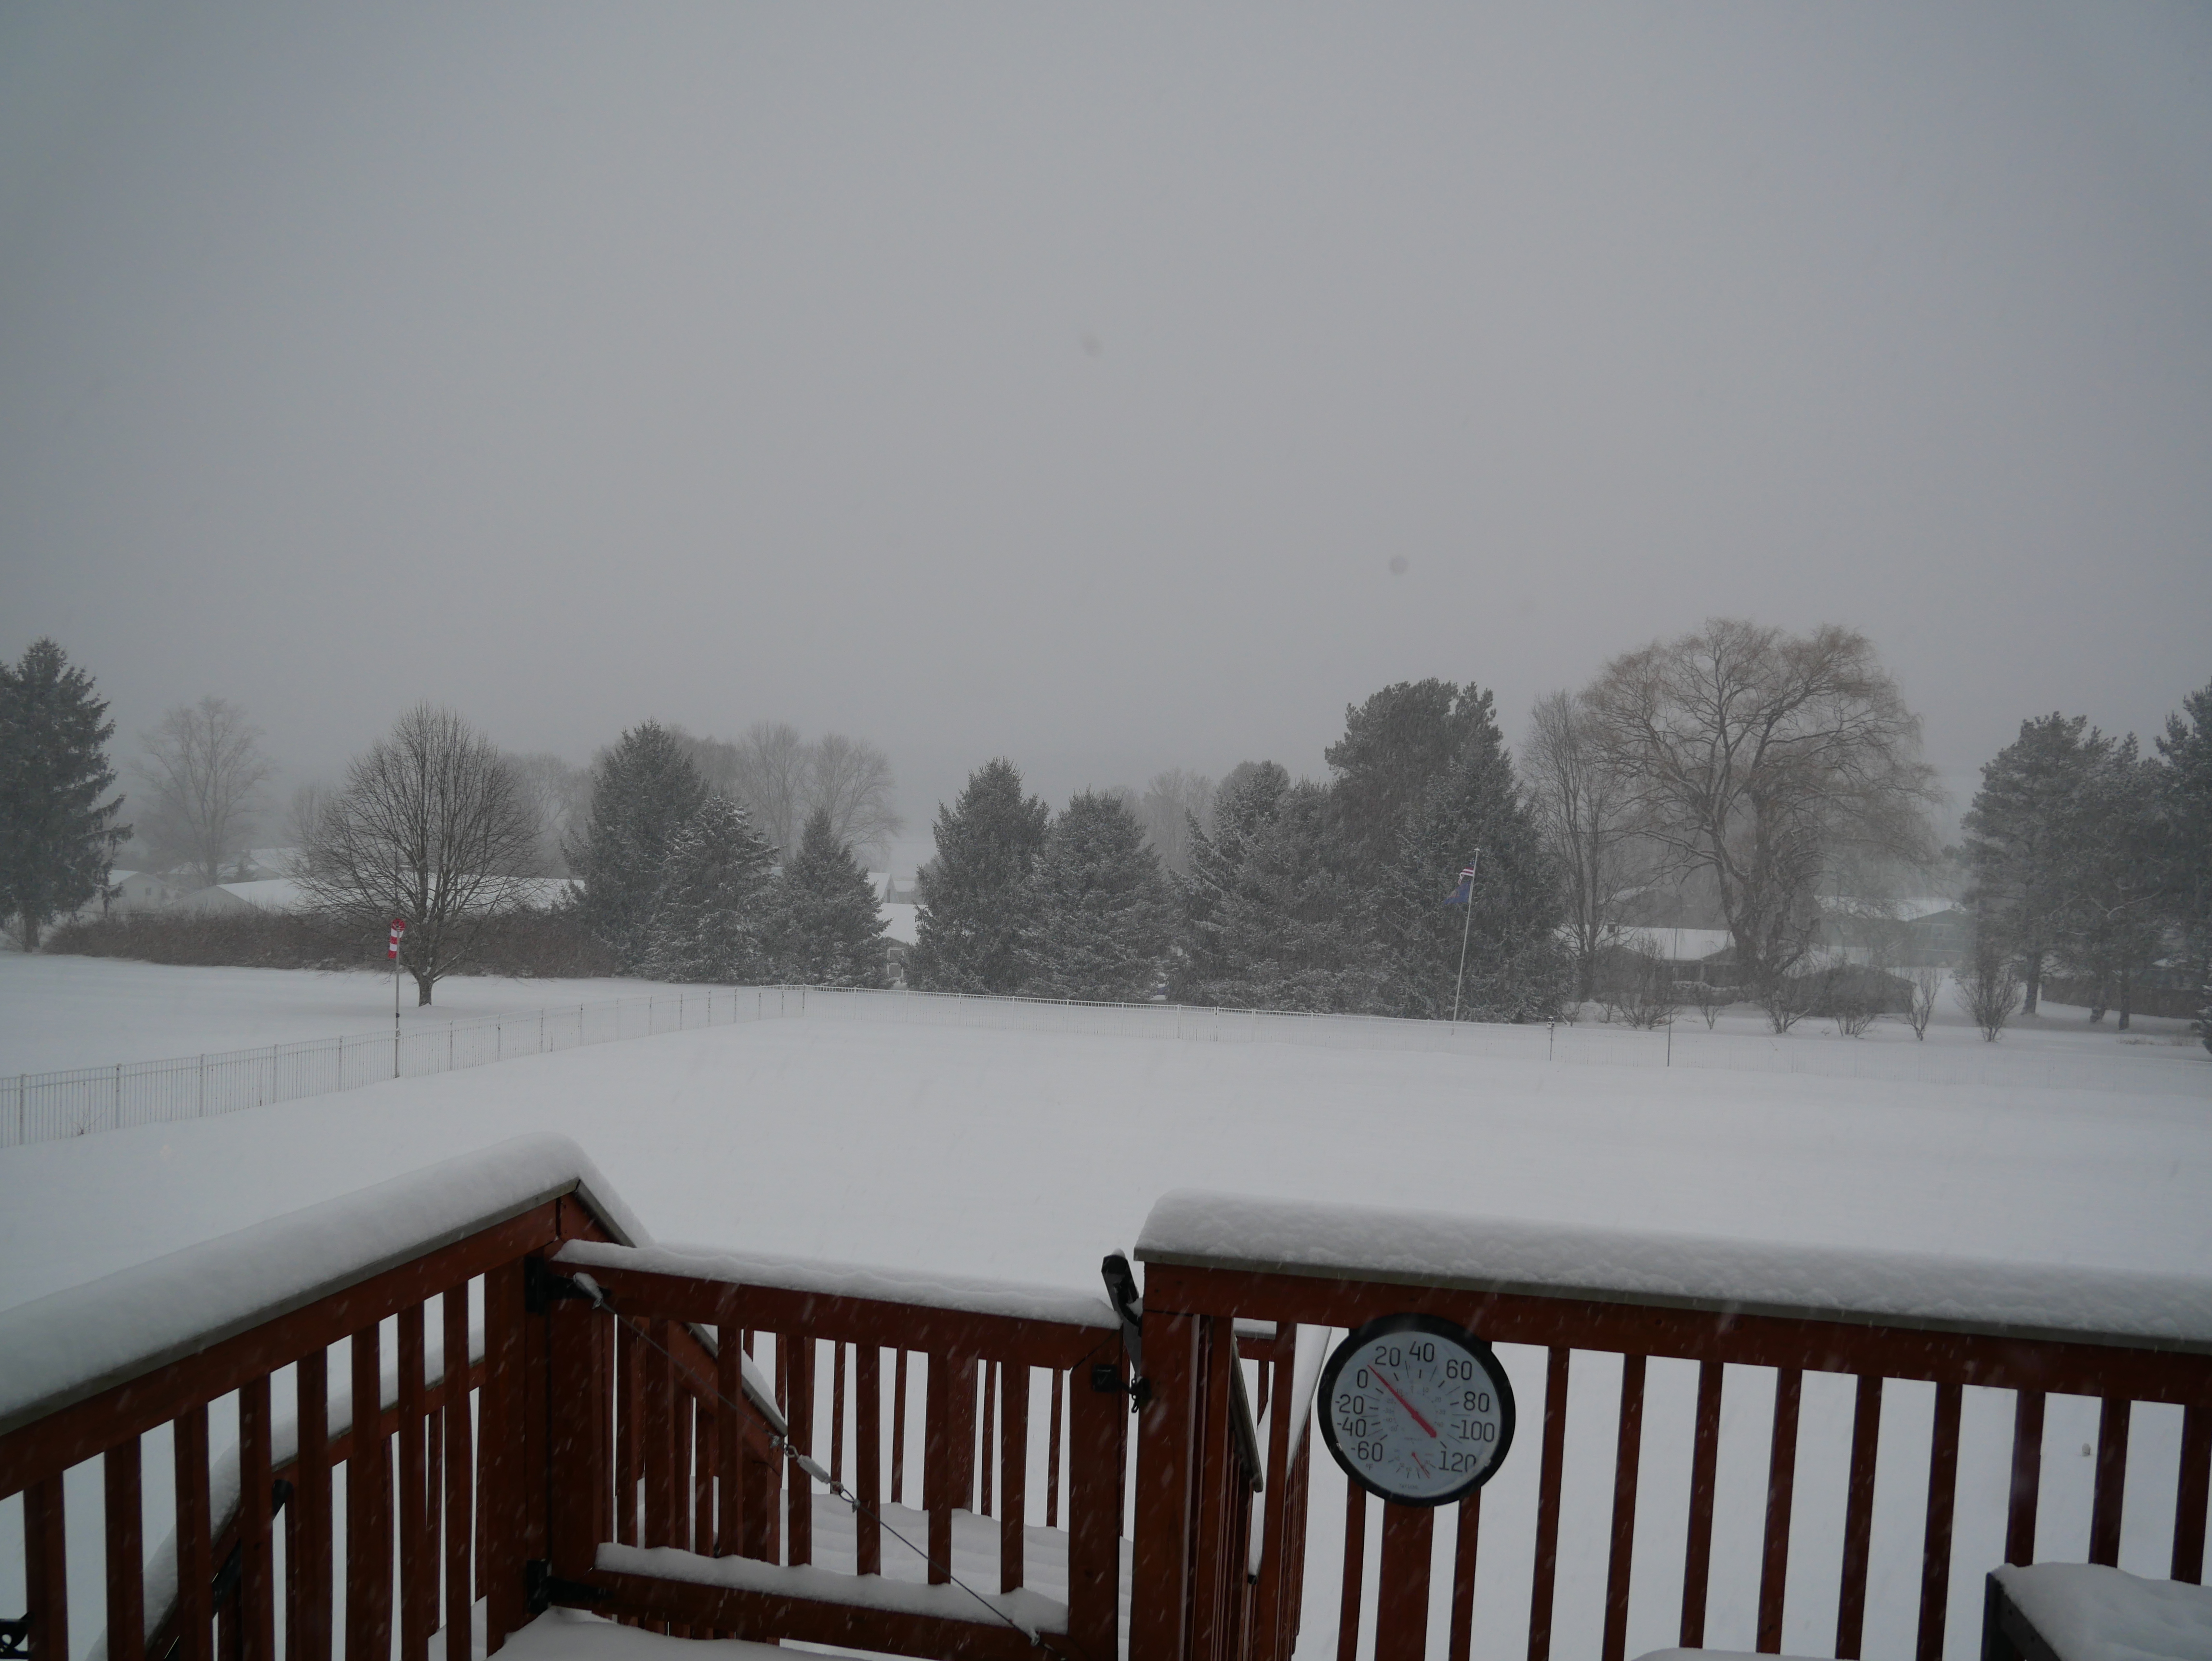
There were 20.9 inches of snow for the month, with a maximum daily total of 15.5 inches on January 25.
December was below normal for temperature. The high for the month was 54.3 deg. F, recorded on December 19. The low for the month was 1.1 deg F, recorded on December 9. There were 31 days when the minimum temperature was at or below 32 F, 10 days when the maximum temperature was at or below 32 F, and 0 days when the minimum temperature was below 0. There were 1132 heating degree days and 0 cooling degree days.
December was a below-normal month for precipitation, with 1.92 inches of liquid precipitation recorded, which was 1.26 inches below normal. The maximum rainfall in a single day was 0.72 inches recorded on December 19. There were 10 days of rain >.01 in, 6 >.10 in, and 0 > 1 in.
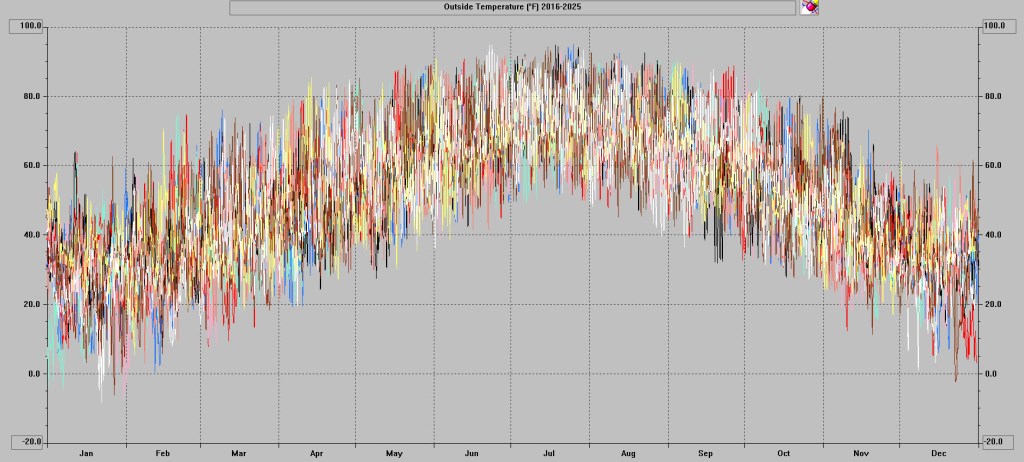
Overall, the year’s temperatures were near normal. The annual mean of 50.4 F was 0.1 F above normal. The annual precipitation of 42.71 inches was 1.18 inches above normal.
2025 Weather Data
January
January was the coldest month of 2025 and with a monthly mean of 23.7.7 F, which was 3.5 F below normal, with a high of 44.8 F and a low for the month of -8.7 F. Precipitation was 1.46 inches below normal with 1.46 inches of liquid precipitation. There were 9.3 inches of snow for the month, with a maximum daily total of 2.4 inches on January 4.
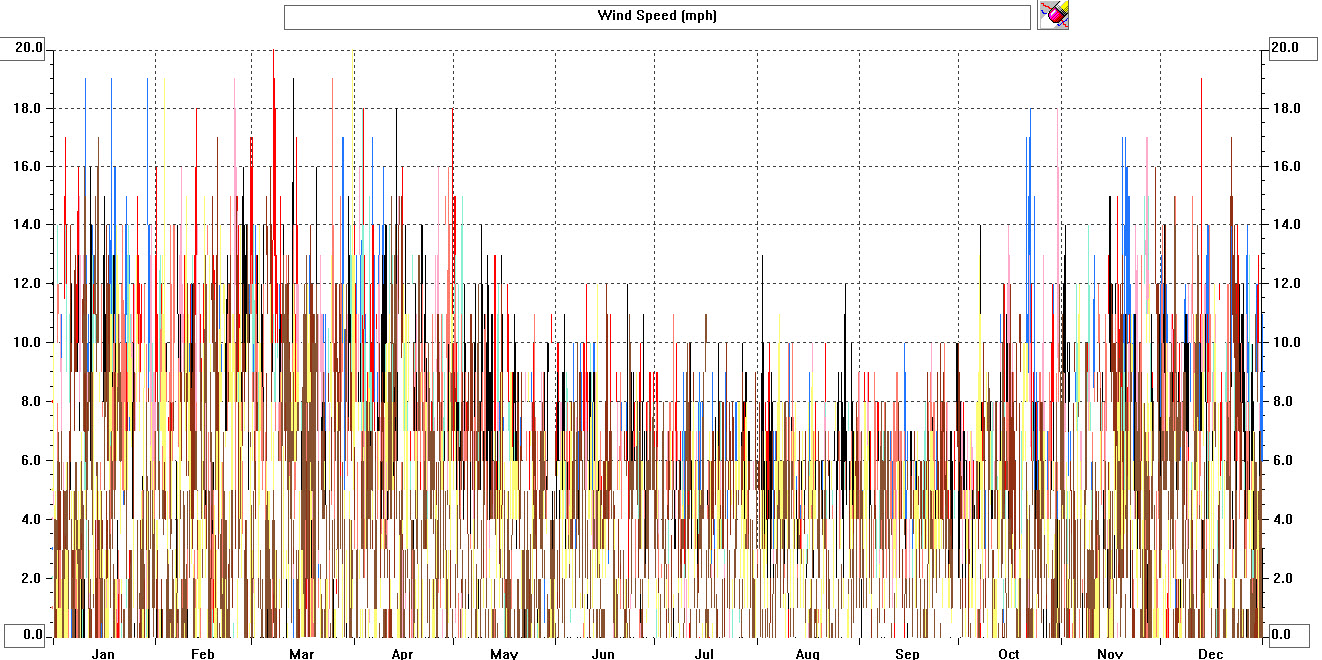
High wind speed of 37 mph on January 29.
February
February was a near-normal month for temperature, with a mean of 29.4 F, which was 0.3 F above normal. The high was 53.8 F, and the low was 7.9 F. Precipitation was 0.42 inches above normal at 2.88 inches. There were 5.4 inches of snow for the month, with a maximum daily total of 1.6 inches on February 16.
High wind speed of 40 mph on February 16.
March
March temperatures were 6.5 F above normal with a mean of 43.5 F. The high was 74.8 F, and the low was 14.1 F. Precipitation was 1.17 inches below normal with 2.21 inches of liquid precipitation. There was no measurable snow accumulation. There was 0.3″ of snow accumulation.
The highest recorded wind speed was 46 mph.
April
Temperatures were 2.4 F above normal in April with a mean temperature of 51.7 F. The high was 85.0 F, and the low was 19.4 F. Rainfall was 0.57 inches above normal at 4.08 inches.
There was a trace of snow in April.
High wind speed of 49 mph on April 29.
May
Temperatures were 1.3 F below normal with a mean temperature of 58.5 F. The high was 78.7 F, and the low was 36.9°F. Precipitation was 8.25 inches, 4.61 inches above normal. May was the rainiest month of 2025.
The high wind speed was 34 mph.
June
Temperatures for the month were 2.1 F above normal with a mean of 70.2 F. The high for the month was 95 F and the low was 36 F. Precipitation was 1.72 inches above normal, with 5.81 inches of rainfall.
The high wind speed was 35 mph.
July
July was the warmest month, and temperatures were 2.3 F above normal with a mean of 74.5 F. The high for the month was 93.7 F, and the low was 52.2 F. Rainfall was 1.51 inches above normal, with 5.30 inches of precipitation.
The high wind speed was 25 mph.
August
August temperatures were 3.1 F below normal with a mean of 67.3 F. The high was 90.8 F, and the low was 39.4 F. Precipitation was 2.32 inches below normal at 1.84 inches.
The high wind speed was 23 mph.
September
Temperatures were 0.7 F above normal with a mean of 63.9 F. The high was 88.5 F, and the low was 36.5 F. There were 3.46 inches of rainfall, which was 0.49 inches below normal.
High wind speed was 28 mph.
October
October was near normal with temperatures at 0.3 F below normal, with a mean of 51.6 F. The high was 81.6 F and the low was 27.2 F. Rainfall was 3.26 inches, which was 0.20 inches below normal.
The high wind speed was 32 mph.
November
Temperatures in November were near-normal at 0.6 F below normal with a mean of 40.6 F. The high was 67.9 F and the low was 23.4 F. Precipitation was 2.24 inches, 0.75 inches below normal. The first snowfall of the season was on November 11.
The high wind speed was 39 mph.
December
December temperatures were 3.8 F below normal, with a mean temperature of 28.4 F. The high for the month was 54.3 F deg. F, and the low was 1.1 F. Precipitation with 1.92 inches of liquid precipitation recorded, which was 1.26 inches below normal. There were 7.8 inches of snowfall.
November was 0.6 deg F below normal for temperature. The high for the month was 67.9 deg. F, recorded on November 5. The low for the month was 23.6 deg F, recorded on November 18. There were 16 days at or below 32 F. There were 731 heating degree days and 0 cooling degree days.
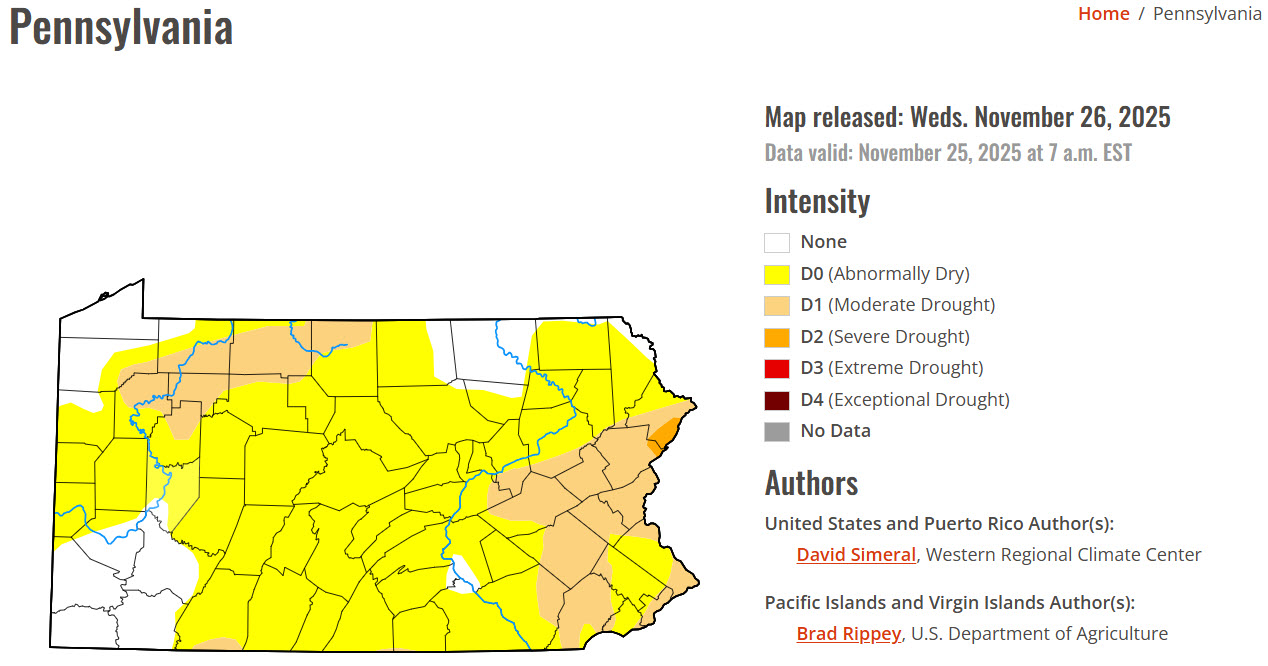
November was a below-normal month for precipitation with 2.24 inches of rainfall recorded, 0.75 inches below normal. The maximum rainfall in a single day was 0.52 inches recorded on November 11. There were 11 days of rain >.01 in, 6 >.10 in, and 0 > 1 in.
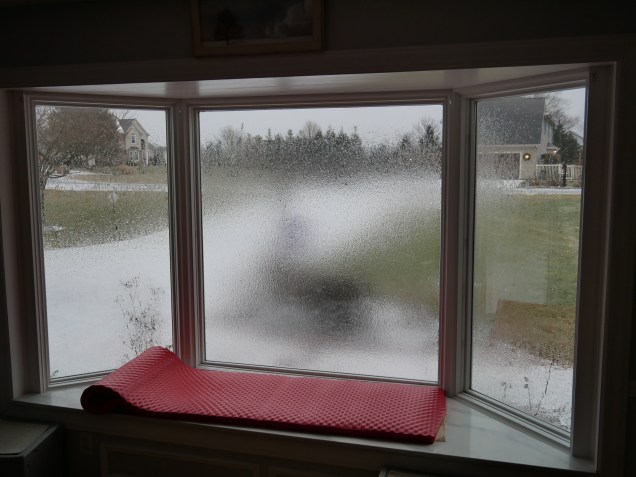
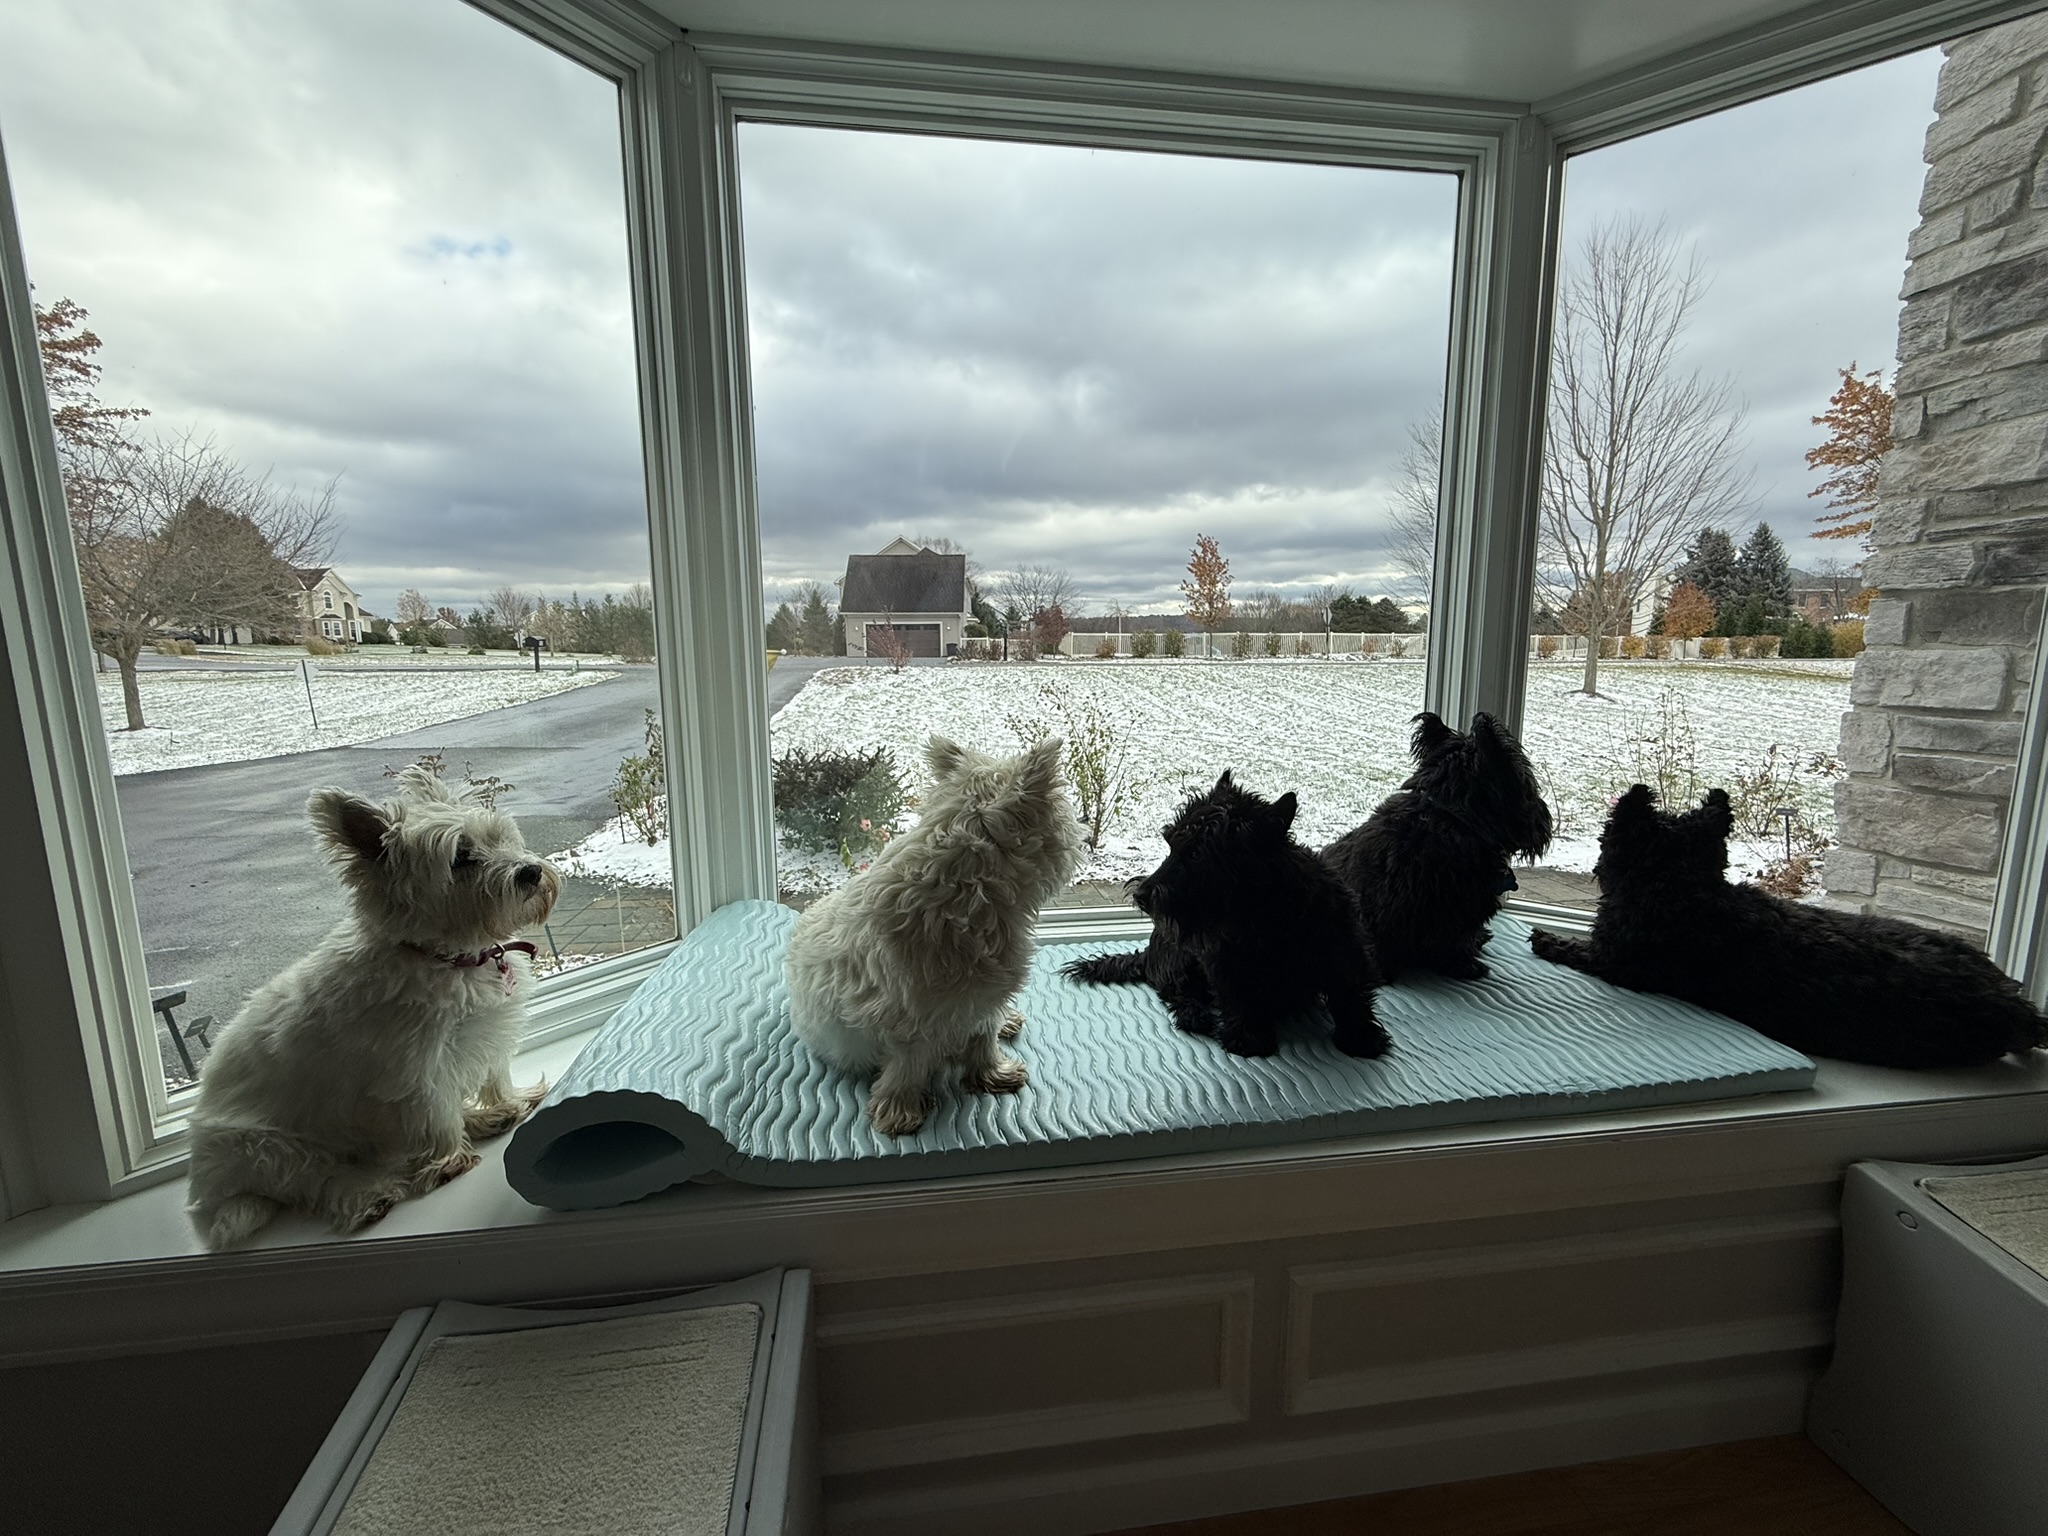
The first snowfall of the season was on November 11.
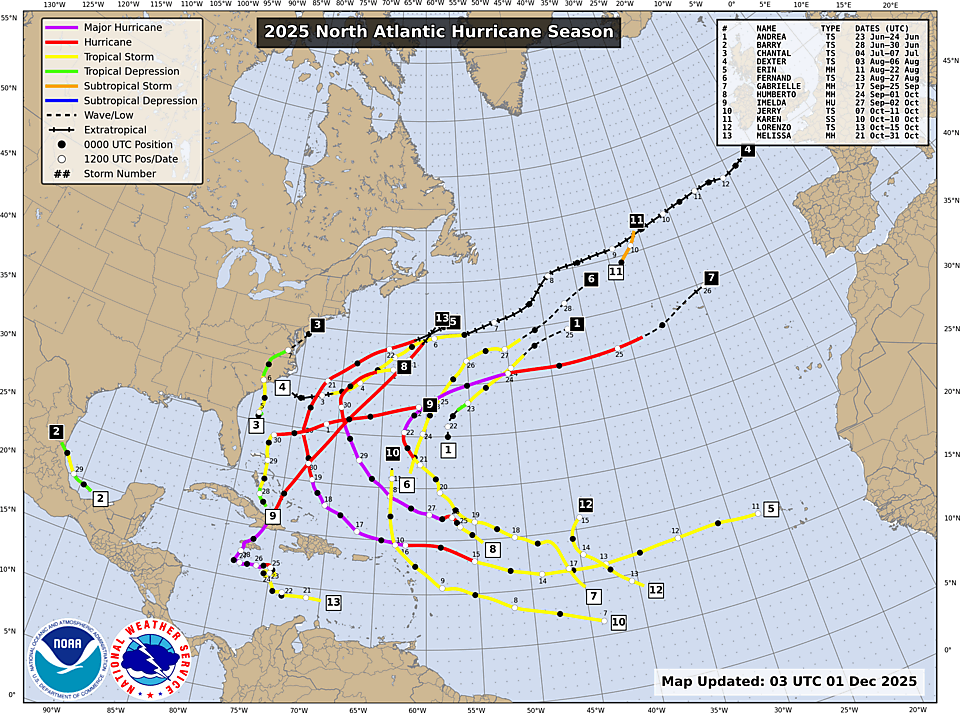
The 2025 Atlantic hurricane season has ended. There were 13 named storms, 5 hurricanes, and 4 major hurricanes (>= 3 on the Saffir-Simpson Scale). There were no U.S. hurricane landfalls, and no hurricanes in The Gulf of America.
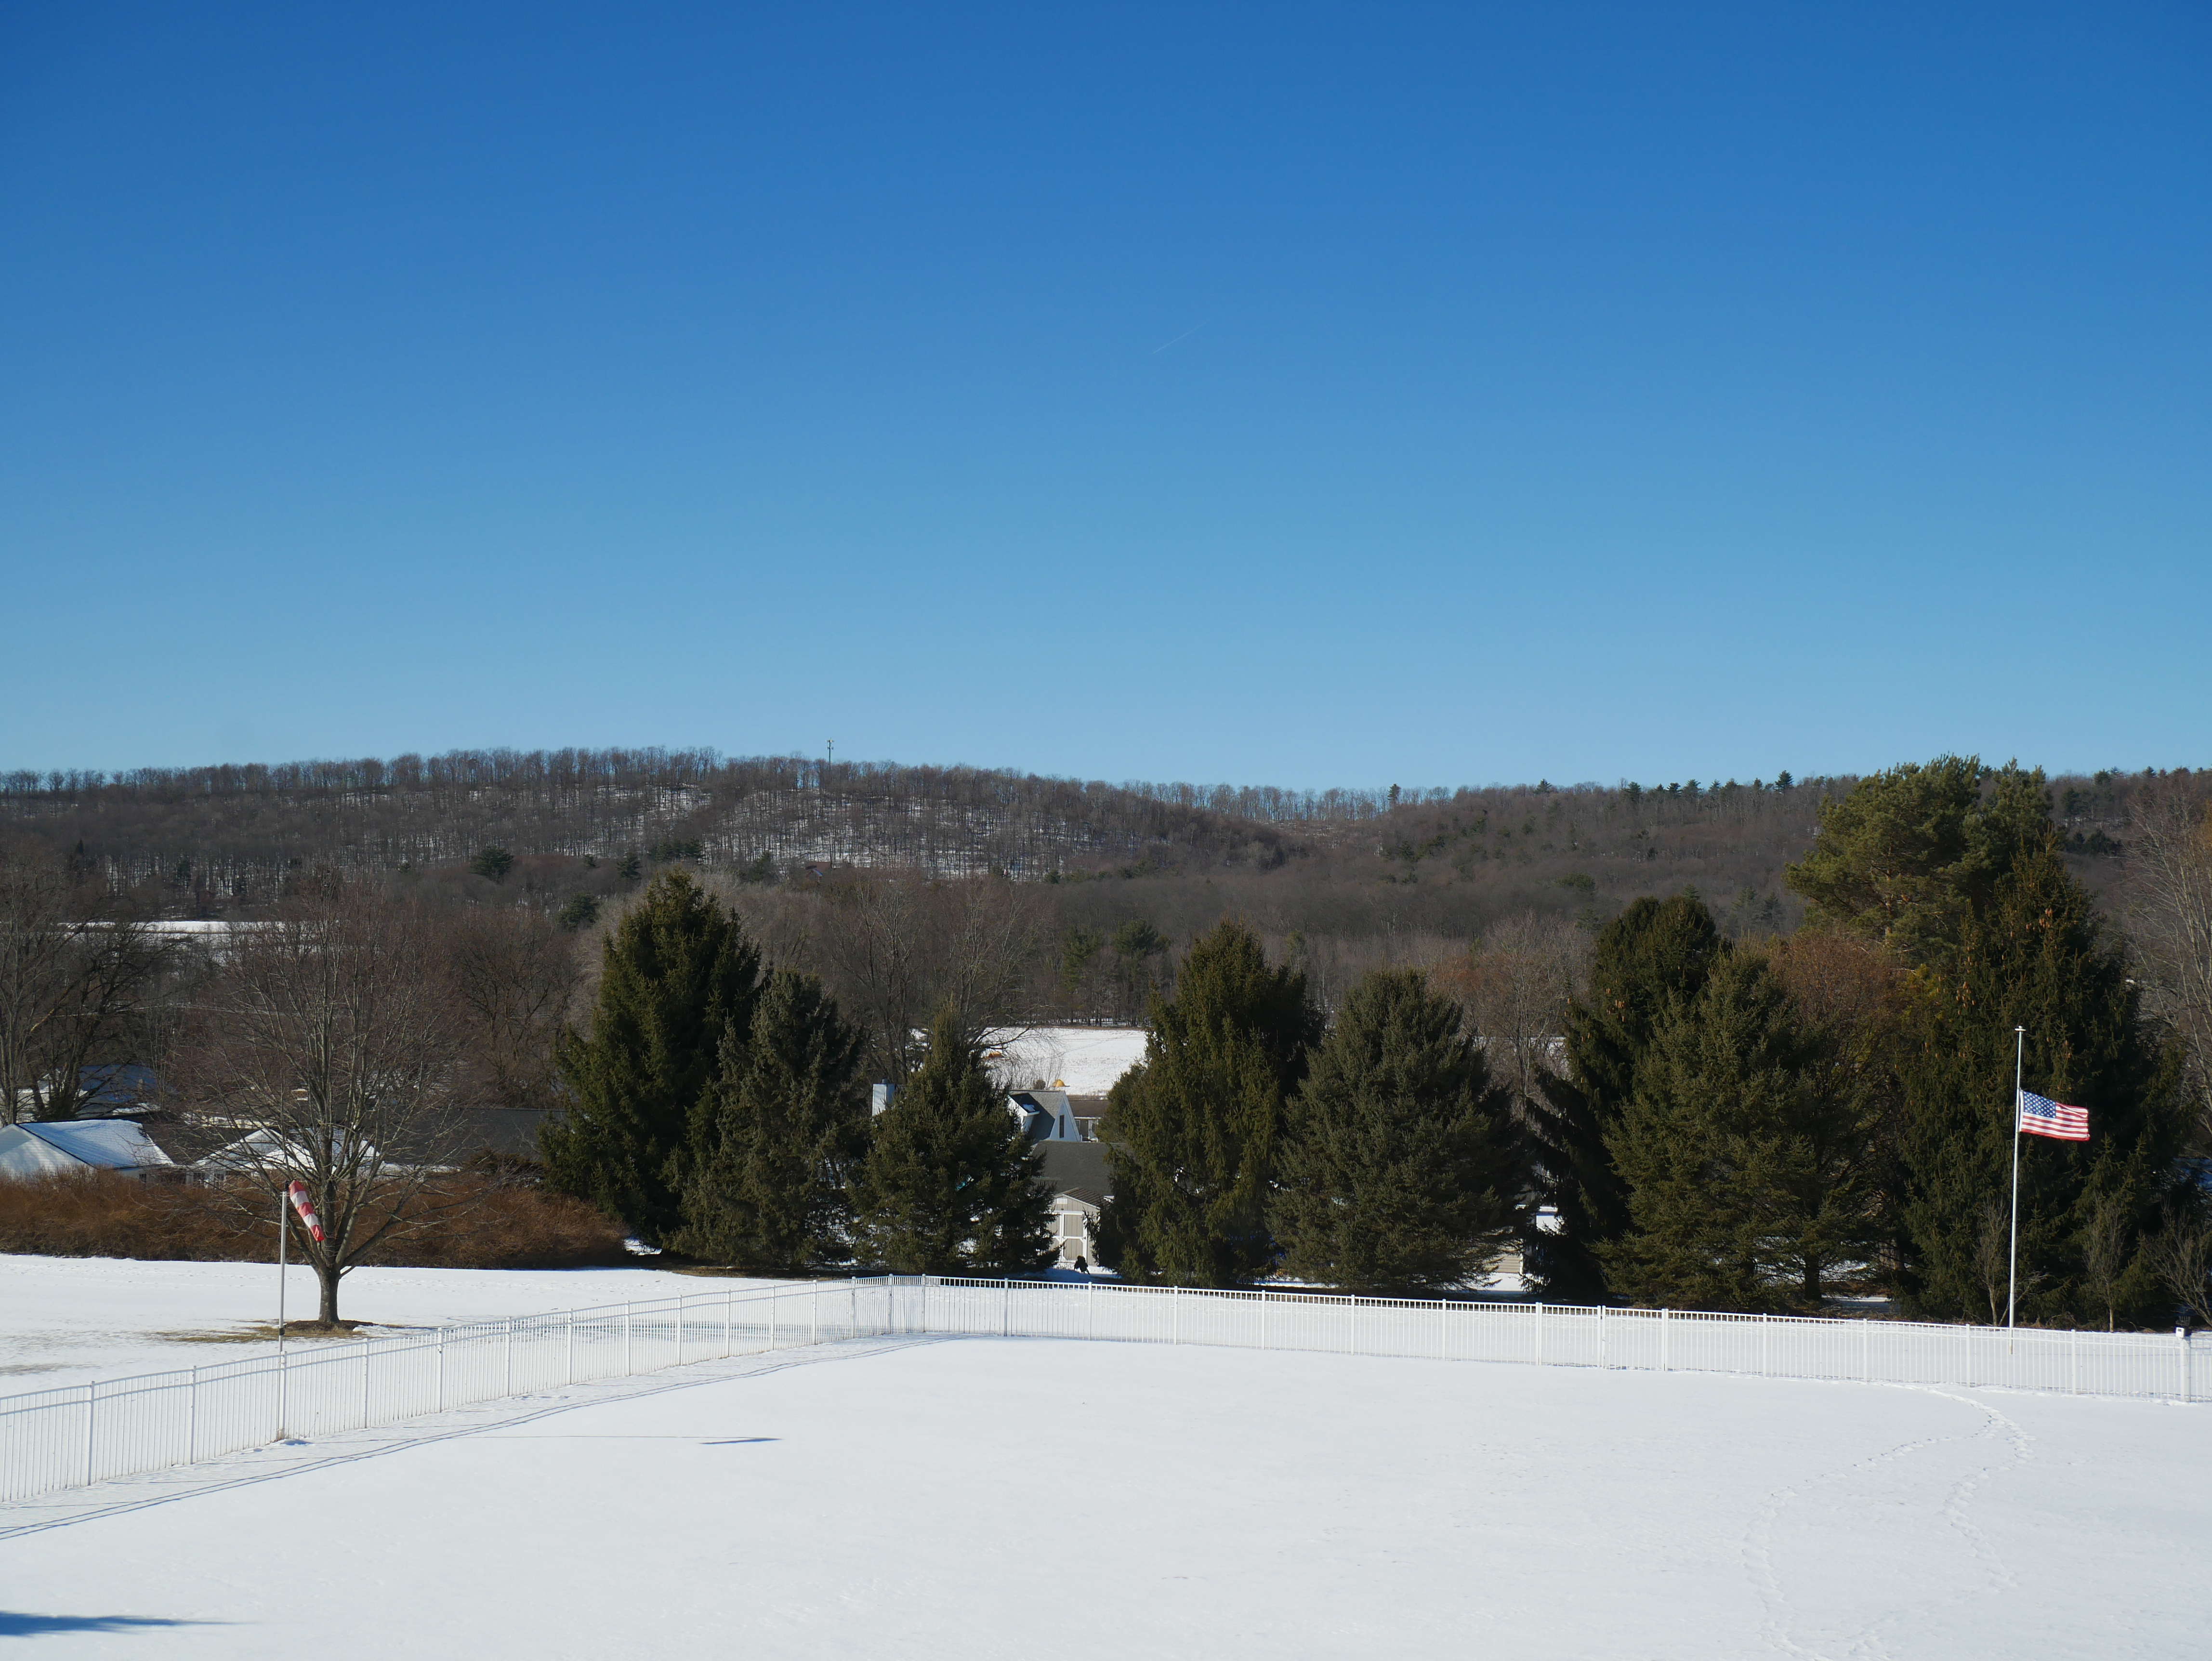
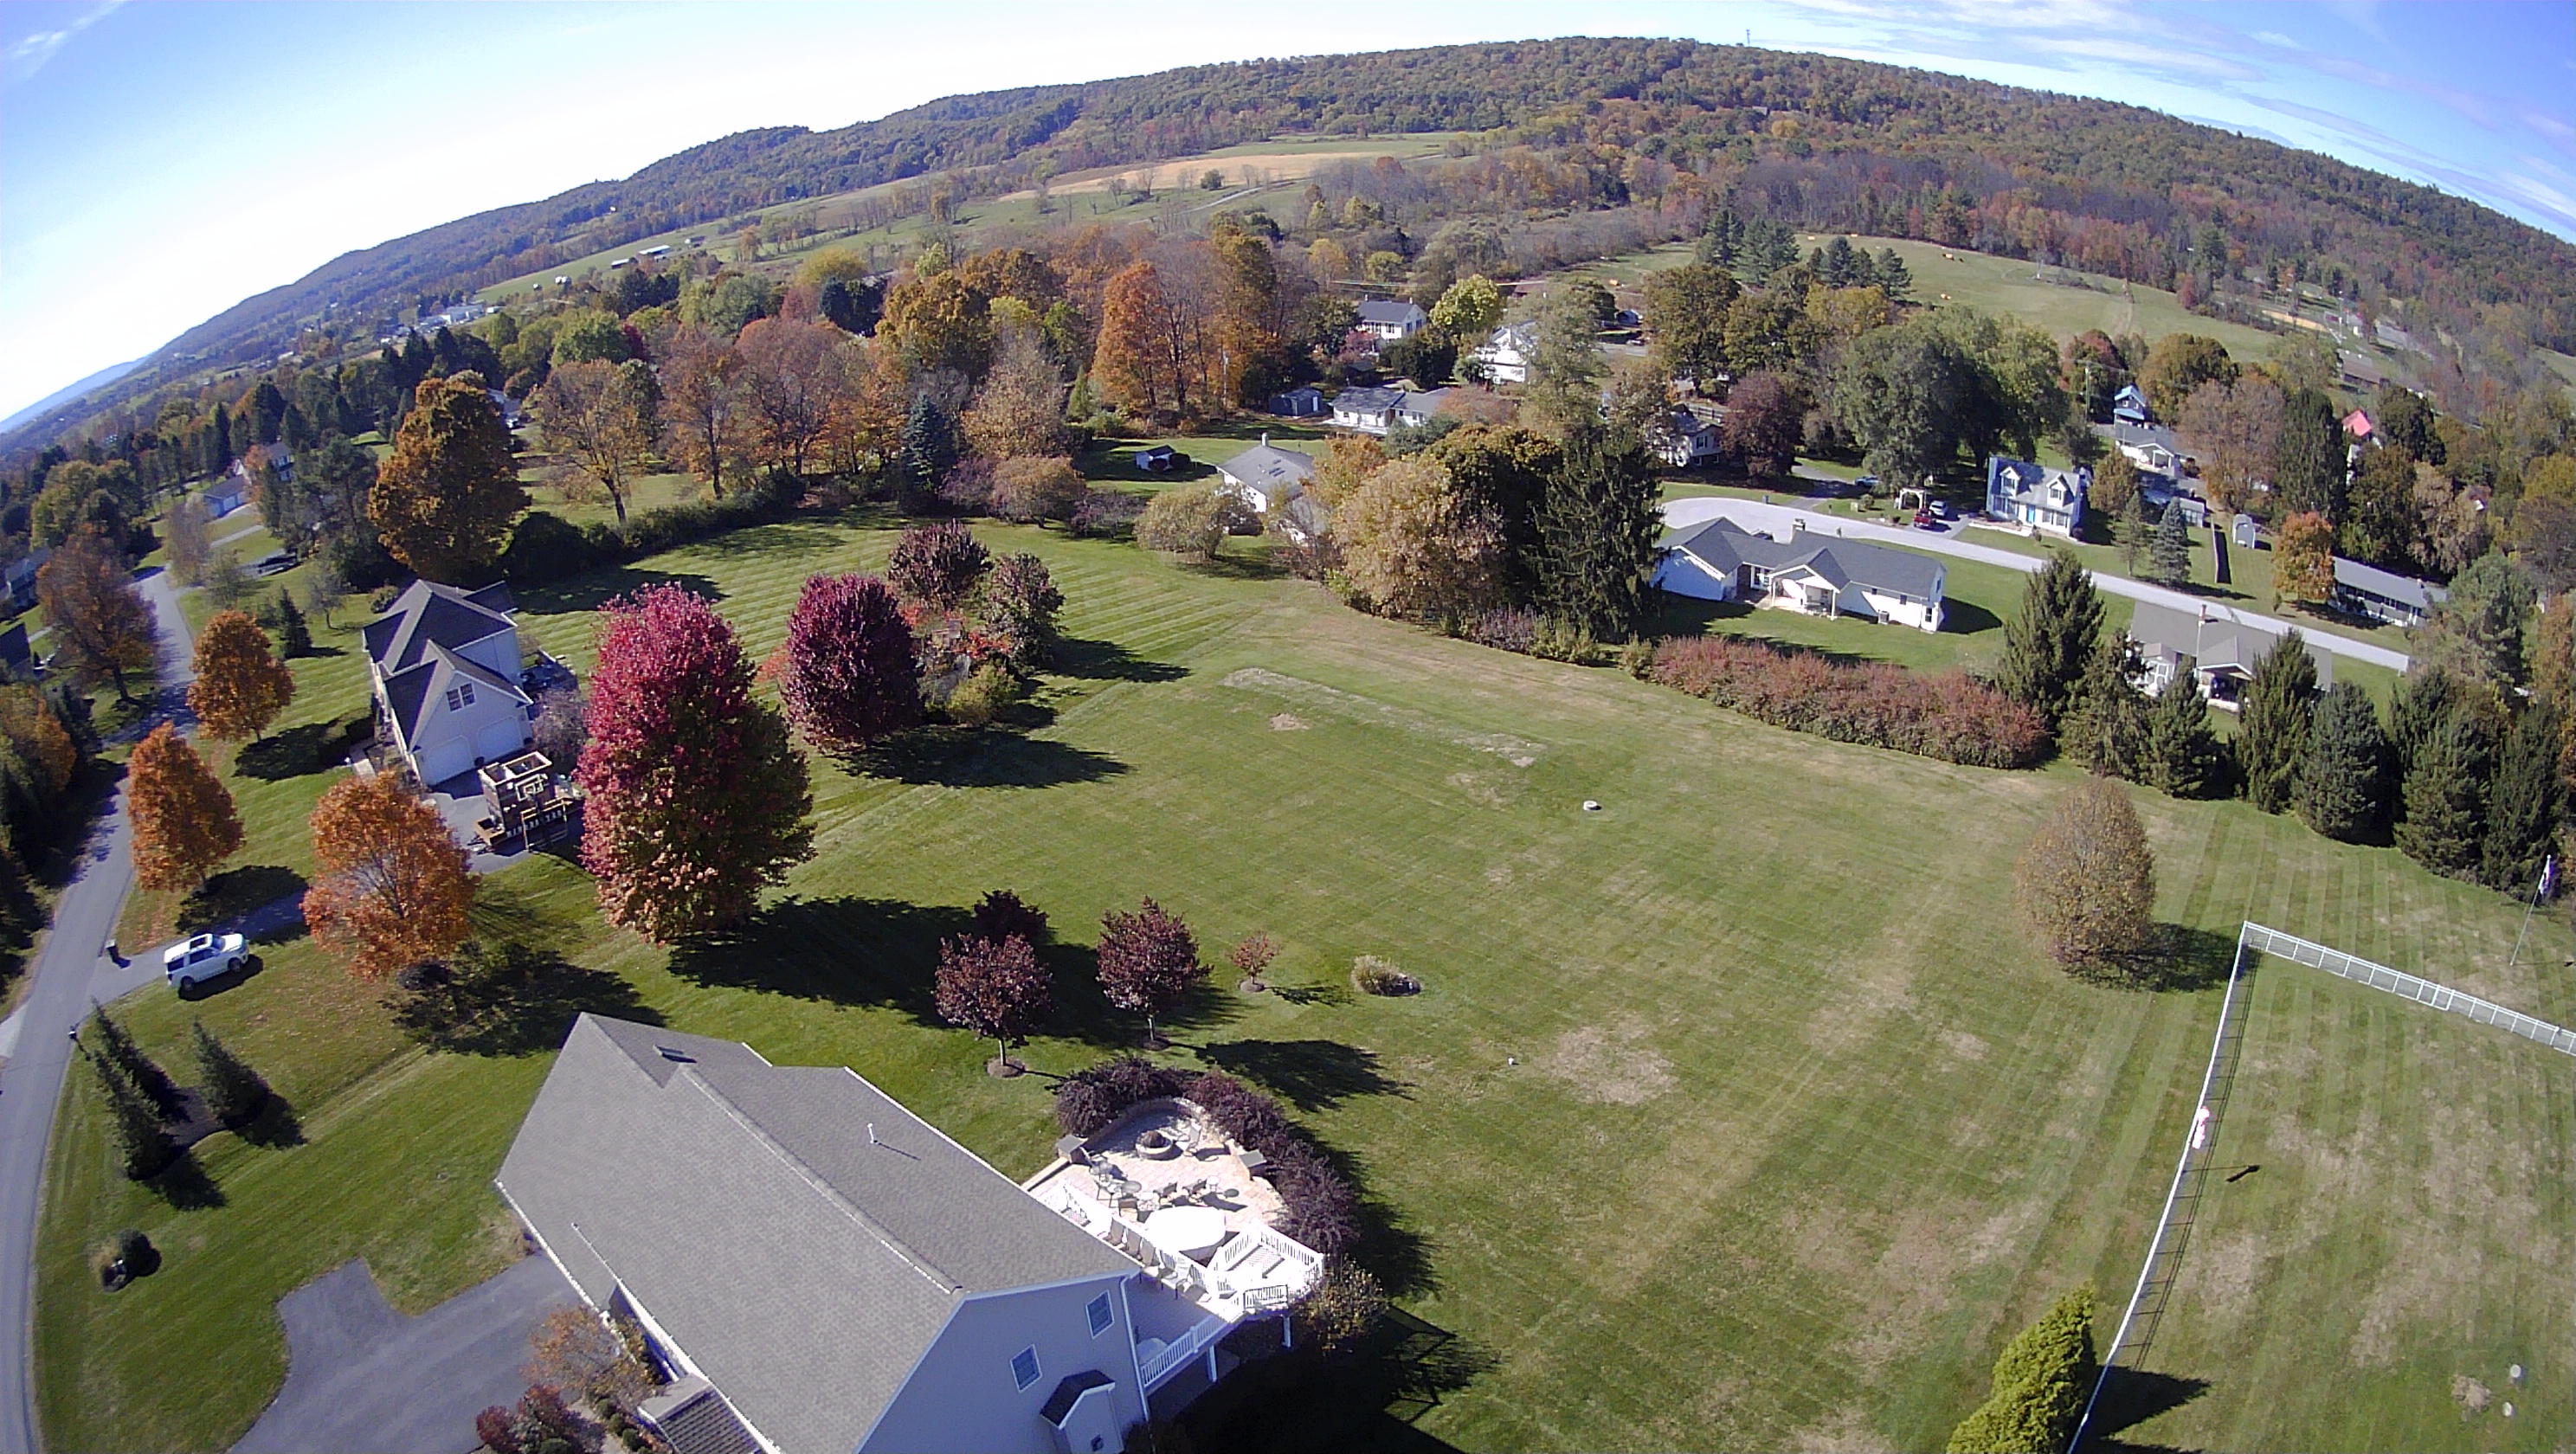
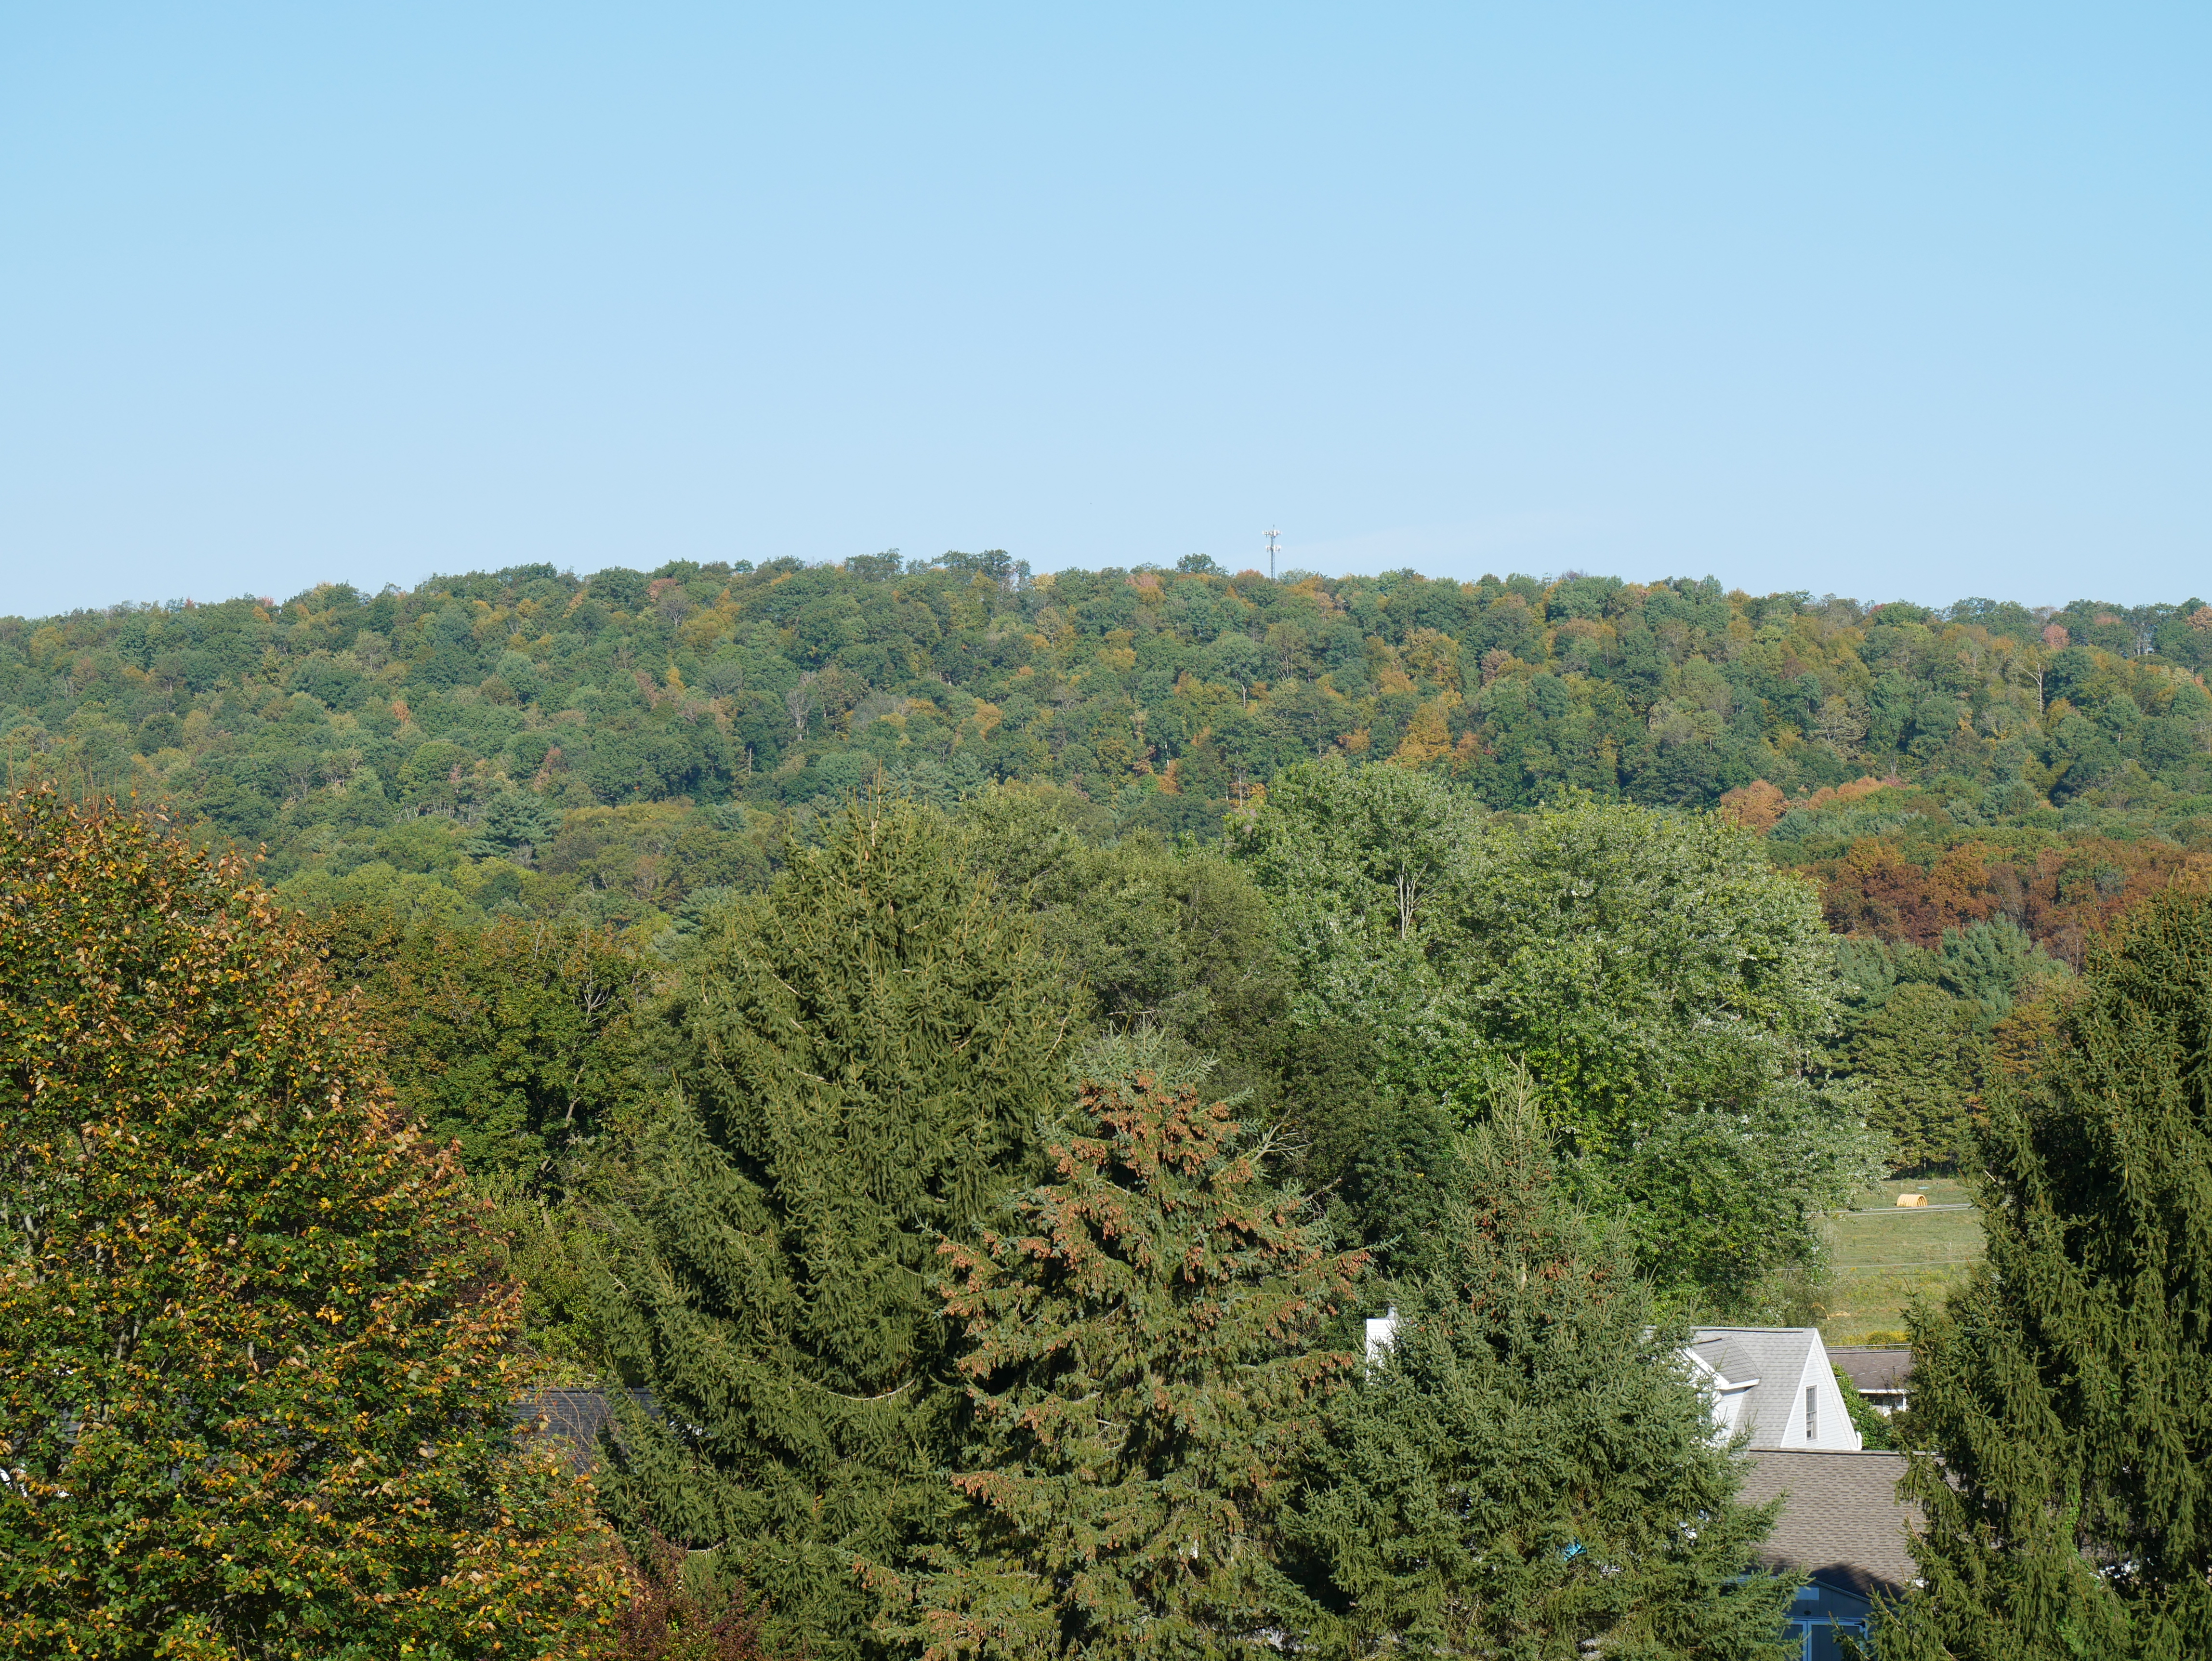
Taken from my quadcopter drone over Halfmoon Valley.
October was 0.3 deg F below normal for temperature. The high for the month was 81.6 deg. F recorded on October 6. The low for the month was 27.2 deg F, recorded on Oct 27. The first freeze of the season, 31.4 F, was recorded on October 10. There were 0 days at or above 90 deg F and 5 days at or below 32 deg F. There were 436 heating degree days and 20 cooling degree days.
October was below average for precipitation with 3.26 inches of rainfall recorded, which was 0.20 inches below normal. The maximum rainfall in a single day was 1.47 inches recorded on October 30. There were 8 days of rain >.01 in, 6 >.10 in and 1 > 1 inch.
September was near normal for temperature. The high for the month was 88.5 deg. F recorded on September 19. The low for the month was 36.5 deg F, recorded on September 8. There were 0 days at or above 90 deg F and 0 days at or below 32 deg F. There were 138 heating degree days and 104 cooling degree days.
September had 3.46 inches of rainfall recorded, which was 0.49 inches below normal. The maximum rainfall in a single day was 1.94 inches recorded on September 25. There were 6 days of rain >.01 in, 5 >.10 in, and 1 > 1 in. There were 15 consecutive days without measurable precipitation (Sep 7-21).