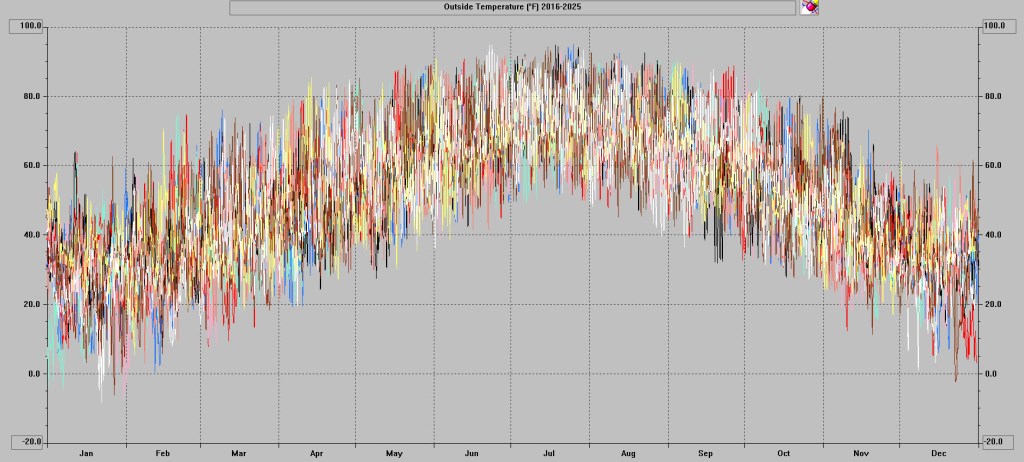
June was 0.2 deg F below normal for temperature. The high for the month was 91 deg. F was recorded on June 11. The low for the month was 42 deg F, recorded on June 2. There were 75 heating degree days and 162 cooling degree days. There was 1 day that was greater than or equal to 90 deg F.
June was an above-normal month for precipitation with 4.65 inches of rainfall recorded, which was 0.56 inches above normal. The maximum rainfall in a single day was 1.43 inches, recorded on June 14. There were 15 days of rain >.01 in, 10 >.10 in, and 1 > 1 in.
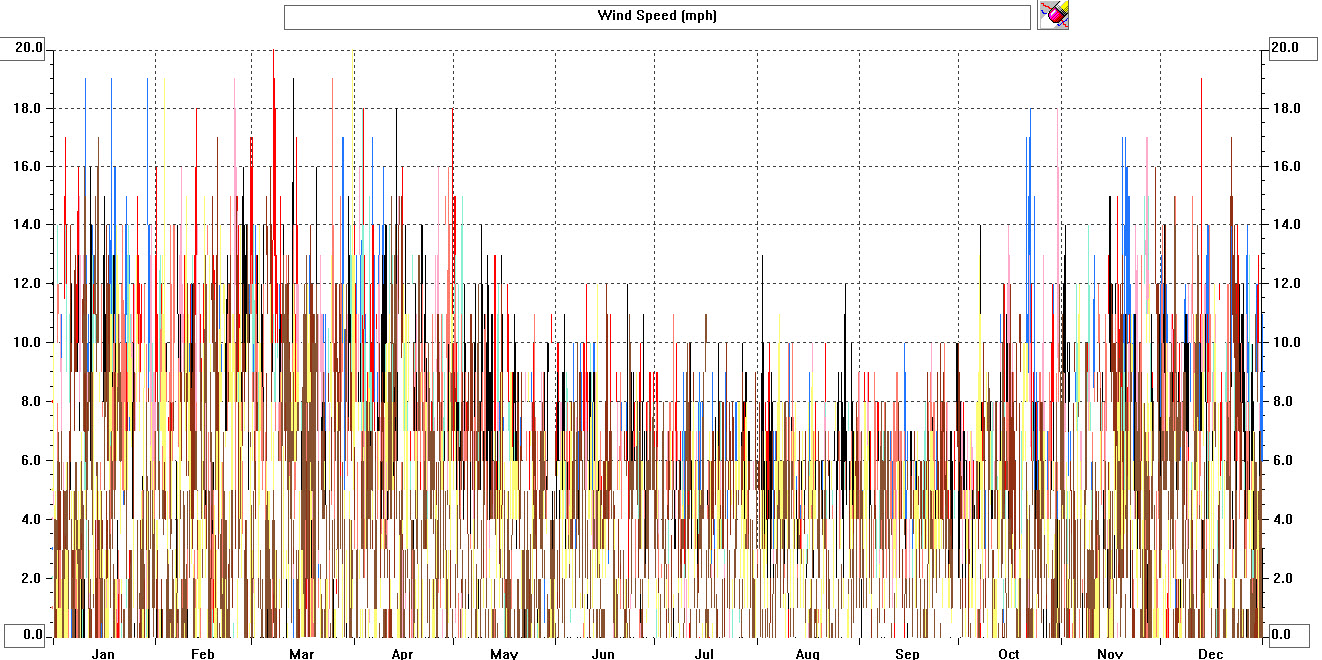
High wind speed of 35 mph on June 11.