Warm, moist summer for Pennsylvania.
Warm, moist summer for Pennsylvania.
Meteorological Spring is officially over. Here is a brief summary of Mar 1-May 31 in Stormstown, PA:
This week, I installed a new UV sensor to my automated weather station. The plot from the first few days of operation appears below.

As you can see the UV intensity was significant. Sunscreen is recommended for indices of 3 or above.

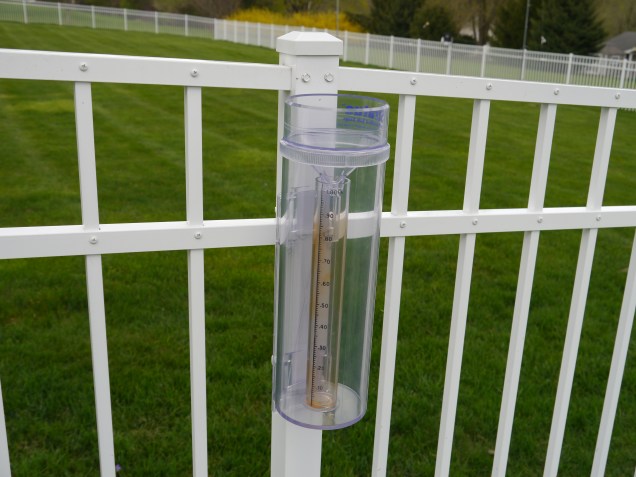
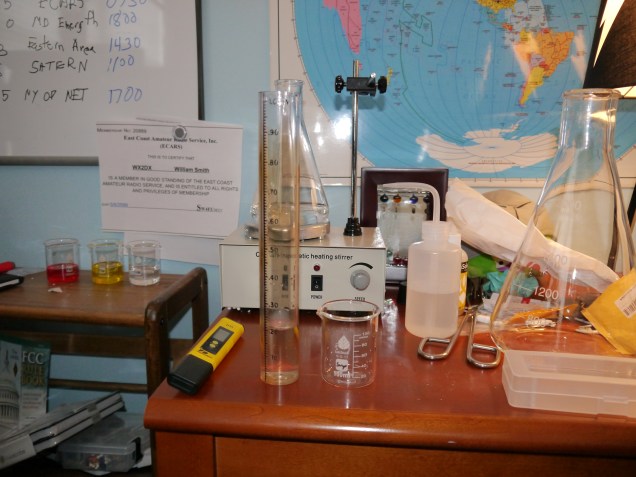
Today, with precipitation in the forecast, I set up my mini-laboratory to measure the pH of the local rainfall in Stormstown, PA. First, I installed a standard rain gauge to collect rainwater.
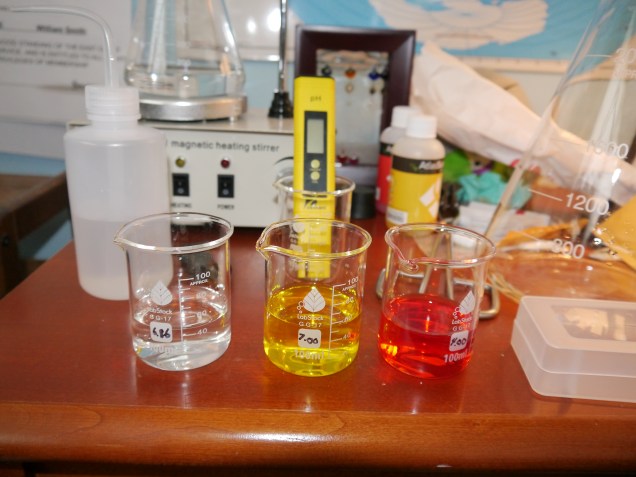
I calibrated my pH meter, prior to taking any actual measurements, using standard reagents of pH of 4.0 and 6.86. I used a pH 7.0 reagent to verify.
After calibration, I waited for some rainfall and then collected my sample.
It had rained 0.20 inches over the past two days.
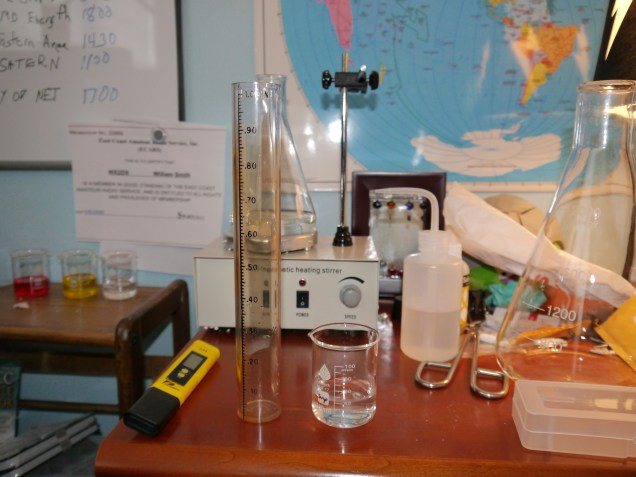
This was about 400 ml of liquid.
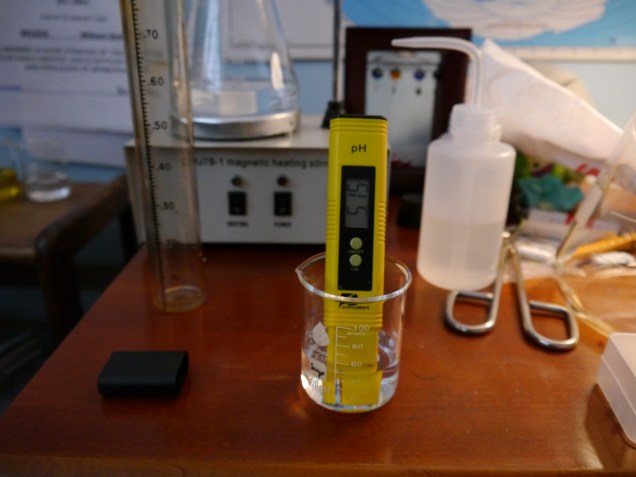
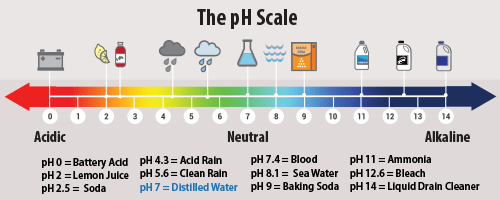
I measured the pH to be about 5.15, which is in the normal range for rainfall but still acidic. It is not considered to be acid rain.
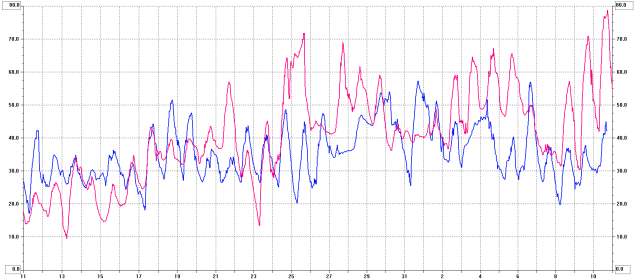
The following is a graph comparing 2017 temperatures (the red line) with 2018 temperatures (the blue line). Temperatures are in deg F from March 11 to April 10. This shows how much colder than last year this spring has been so far.
Easter has come and gone. However, I got up this morning and saw this:
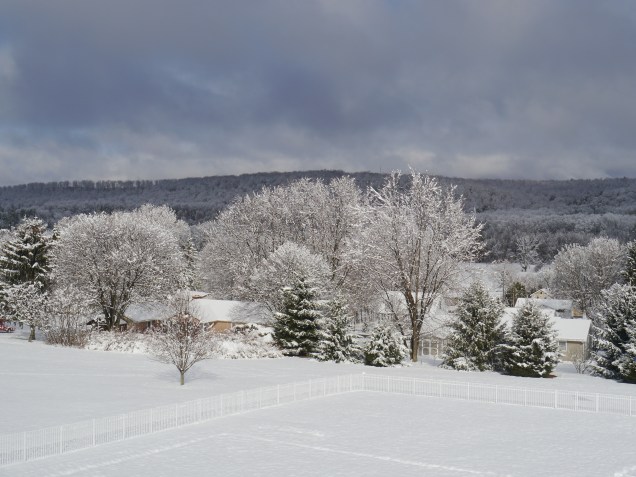
The depth of the snow was 6 1/2 inches. Due to the insolation of nearly 1000 W/m**2, the surface air temperature rose to 45 F, and the snow rapidly melted. It was just about gone before sunset, with just a few piles remaining. There is still a chance of snow Wednesday, Thursday and Sunday.
The above is today’s upper level 300 mb chart. The 300 mb level, about 30,000 ft (9100 m) is where one would typically find the jet streams. The polar jet stream is clearly shown in the upper left portion of the chart. Arctic air has been dominating the northeastern US and is a reason for why the cold weather has been persisting this month.
Meteorological Winter is officially over. Here is a brief summary of Dec 1-Feb 28 in Stormstown, PA:
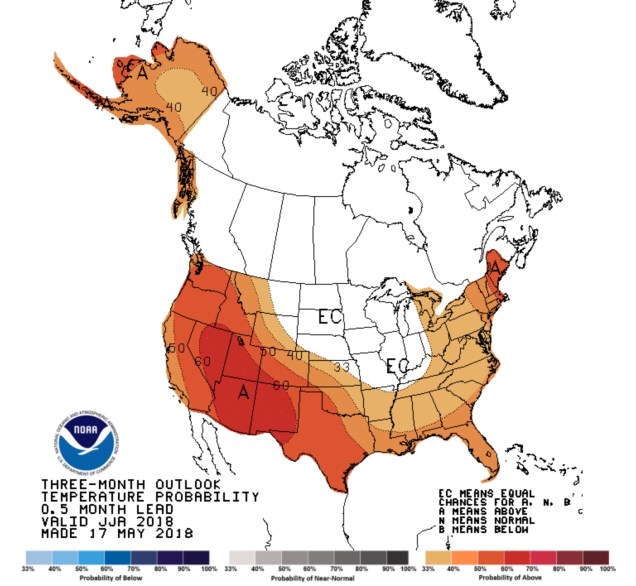
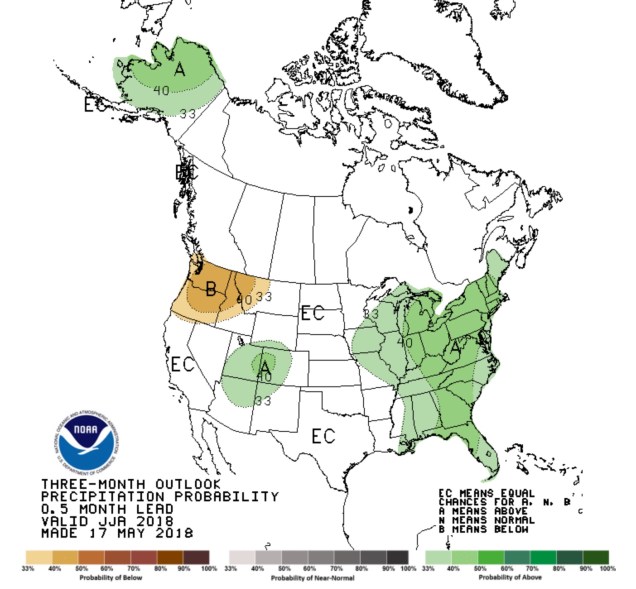
Here is the 3-month outlook for March, April and May of 2018.


Looks like a warm and wet Spring for the northeast. Hot and dry in the southwest.
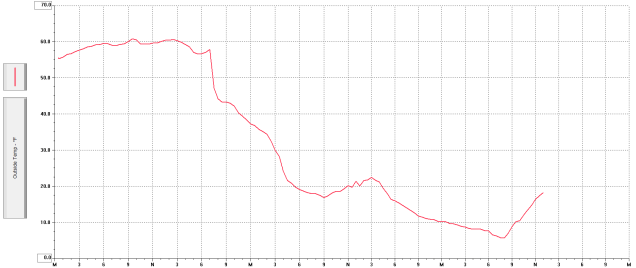
The temperature in Stormstown dropped 55 F from Friday afternoon to Sunday morning. It was definitely shirtsleeve weather on Friday and now it’s a frigid 20 F. The low this morning was 5 F. Cold temperatures are expected for much of the week. High temperatures are expected to be above freezing on Thursday and Friday.
