First Snowfall of the Season

First snowfall of the season in Stormstown, PA. The forecast today called for a chance of snow showers (60%). Instead, there was moderate snow, starting around 10 AM EST. Later, the flakes started to fall in clumps.

Air temperatures remained well above freezing for most of the day, so there was little or no accumulation in the area. However, to the southwest, in The Laurel Highlands, travel was affected significantly.

Harvey and Irma Are Not A Sign of Climate Change

at201711_sat 
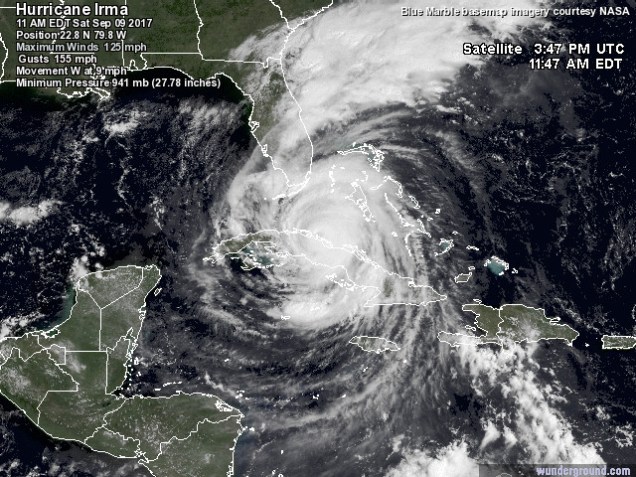
Sorry climate alarmists, but you can not blame this year’s major hurricanes on climate change, global warming or whatever you want to call it.

Posting on the Watts Up With That blog.

Prior to this season, there haven’t been any major hurricane landfalls in The United States since Wilma in 2005. This season is simply an anomaly. In fact, the frequency of major hurricanes has been decreasing.


Summer of 2017: Weather Summary

IMG_0066
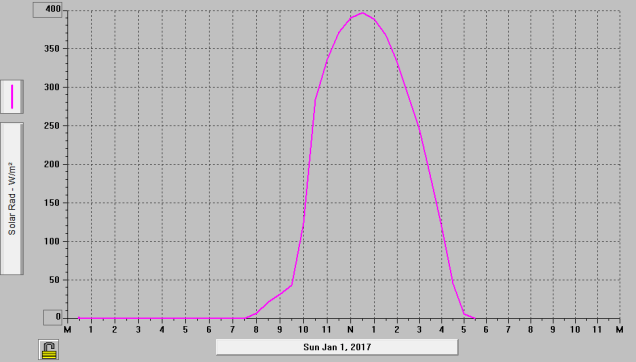
Meteorological summer has ended. Here is a summary of the summer’s weather in Stormstown, PA.

Overall, it was a cooler than average summer, especially during August. June was about a degree Fahrenheit below normal, July was near normal, and August was 3.3 degrees F below normal. There was only one day at or above 90 deg. F (91 F on June 13).

Precipitation was below normal for the most part, even though July was an inch above normal. The maximum single day rainfall was 1.33 inches on July 14.

Highest wind speed was 40 mph on August 19.

Halfmoon Valley Rainfall

After the rainfall from yesterday and early this morning (1.10 inches), the annual precipitation is now at a surplus of 0.17 inches. Monthly precipitation has been below normal for January, February, March and April. May is not quite over, but the rainfall for the month is 1.74 inches above normal.
Outlook
The outlook for the summer months of June, July and August indicates equal chances for a near normal amount of precipitation.

NYT Says We’re Too Dumb To Understand Climate Change

By Robert Tracinski I recently wrote about the wretched reporting on the claim that 2016 was the “hottest year on record,” using as my main example a New York Times article by Justin Gillis that gave his readers none of the relevant numbers they could use to evaluate that claim. None of them. If you…

via NYT: Our Readers Are Too Dumb To Understand Global Warming Numbers – Hide Fact that Claimed ‘Hottest Year’ was within margin of error —

Yes, where are the error bars?!

First Day of Pyranometer Operation

In a previous post, I talked about installing a new pyranometer to my weather station. Below is a graph of today’s solar radiation flux in W/m^2.

solrad

The graph clearly shows when the instrument was in shade (7:30 – 9:30 AM EST). Maximum value was after noon due to the fact that the longitude is about 3 deg west of the 75th meridian and because the equation of time for today is 3 minutes. The maximum solar elevation angle was about 28 deg. The optical depth of the atmosphere is significantly higher at such a low angle than if the sun was at zenith.

2016 Climatological Summary

                            2016 ANNUAL CLIMATOLOGICAL SUMMARY

CITY: Stormstown   STATE: PA  
ELEV:  1385 ft  LAT: 40.8  LONG: 77.87

               TEMPERATURE (°F), HEAT BASE 65.0, COOL BASE 65.0
                          DEP.  HEAT  COOL                                          
        MEAN  MEAN        FROM  DEG   DEG                        MAX  MAX  MIN  
 YR MO  MAX   MIN   MEAN  NORM  DAYS  DAYS  HI  DATE  LOW  DATE  >=90 <=32 <=32 
--------------------------------------------------------------------------------
 16  1  34.3  17.3  25.9   1.3  1211     0  59.4  31   5.0    5    0   12   30 
 16  2  40.0  23.1  31.9   5.1   960     0  65.9  28   0.5   12    0    7   22 
 16  3  56.6  33.6  45.3   8.8   618     8  76.2   9  16.0    3    0    0   14 
 16  4  59.6  35.7  48.4   0.7   522    23  80.9  18  19.3    6    0    0   10 
 16  5  68.8  48.4  58.5  -0.1   273    71  88.6  28  36.6   19    0    0    0 
 16  6  79.1  56.5  68.2   0.9    70   166  87.7  11  43.2   10    0    0    0 
 16  7  86.2  62.0  73.6   2.4    28   295  95.7  25  49.6    3    9    0    0 
 16  8  85.3  62.7  73.2   3.6    24   278  92.7  12  50.8   23    3    0    0 
 16  9  76.9  53.9  65.1   2.9   127   131  89.0  10  39.8   25    0    0    0 
 16 10  63.9  43.4  53.2   2.1   388    22  79.6  18  28.4   26    0    0    3 
 16 11  54.1  34.3  43.9   3.1   636     2  73.6   2  23.2   23    0    0   13 
 16 12  37.6  24.6  31.2   1.4  1047     0  52.1  27   5.9   16    0    7   24 
--------------------------------------------------------------------------------
        61.9  41.4  51.6   2.7  5905   997  95.7 JUL   0.5  FEB   12   26  116 

                                PRECIPITATION (in)

               DEP.   MAX        DAYS OF RAIN 
               FROM   OBS.          OVER
 YR MO  TOTAL  NORM   DAY  DATE .01   .1   1
---------------------------------------------
 16  1  1.58  -0.92  1.12   10    7    2    1
 16  2  2.99   0.29  1.23    3    9    3    1
 16  3  1.92  -1.38  0.55   13   10    6    0
 16  4  1.85  -1.15  0.50   28   12    5    0
 16  5  3.52  -0.28  0.73   21   17   10    0
 16  6  2.12  -2.08  0.60    5   11    8    0
 16  7  1.16  -2.64  0.26   30    8    7    0
 16  8  5.61   2.31  3.47   10   11    8    1
 16  9  3.49   0.09  1.41   29   10    7    1
 16 10  6.95   4.05  3.62   20   13    7    2
 16 11  1.22  -2.18  0.62   30    5    3    0
 16 12  2.07  -0.73  0.76   18   12    4    0
---------------------------------------------
       34.48 -4.62  3.62  OCT  125   70    6

                                WIND SPEED (mph)
                          DOM
 YR MO   AVG.  HI   DATE  DIR
---------------------------------
 16  1   4.7  42.0   10     W
 16  2   4.5  38.0   25    SW
 16  3   4.1  54.0   28    SE
 16  4   4.0  43.0    3    NW
 16  5   2.7  34.0    8    SW
 16  6   2.9  34.0   12    SW
 16  7   2.5  26.0   15    SW
 16  8   2.2  35.0   16     S
 16  9   2.1  24.0    8    NE
 16 10   2.9  49.0   20   WNW
 16 11   3.9  41.0   20     W
 16 12   5.4  34.0   12     W
---------------------------------
         3.5  54.0  MAR    W