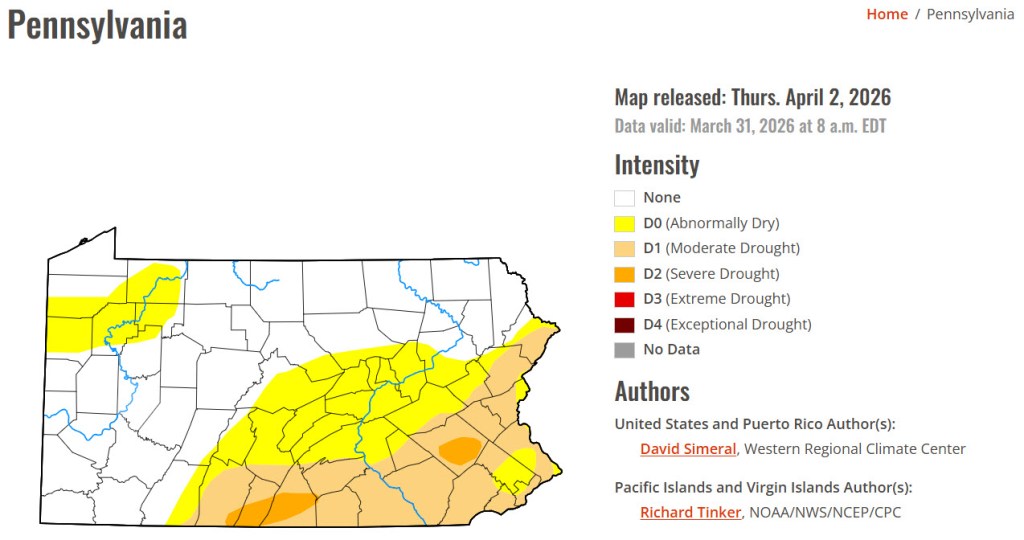
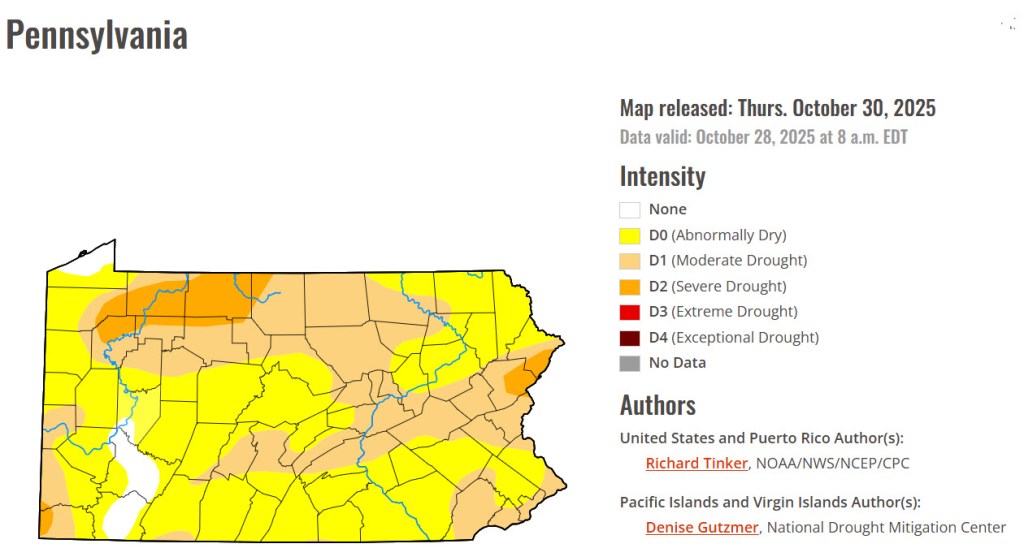
Above-normal rainfall in March has improved drought conditions across the region. If precipitation remains near normal, drought impacts should continue to diminish.
Above-normal rainfall in March has improved drought conditions across the region. If precipitation remains near normal, drought impacts should continue to diminish.
Meteorological Winter is officially over. Here is a brief summary of December 1, 2025-February 28, 2026, in Stormstown, PA:
Number of Days Max T <= 32 F: 37
Number of Days Min T <= 32 F: 83
Number of Days Min T <= 0 F: 4
Max T: 63.3 F – February 28, 2026
Min T: -4.6 F – February 8, 2026
Dec Dep from Normal: -3.8 F
Jan Dep from Normal: -3.7 F
Feb Dep from Normal: -0.1 F
Heating Degree Days: 3421
Cooling Degree Days: 0
Dec Precip: 1.92″, 1.26″ below normal
Jan Precip: 2.29″, 0.63″ below normal
Feb Precip: 0.92″, 1.54″ below normal

February was 0.1 deg F below normal for temperature. The high for the month was 63.3 deg. F, recorded on February 28. The low for the month was -4.6 deg F, recorded on February 9. There were 10 days when the maximum was at or below 32 F , 25 days when the minimum temperature was at or below 32 F, and 1 day when the minimum temperature was less than 0 F. There were 1008 heating degree days and 0 cooling degree days.
February was a below-normal month for precipitation, with 0.92 inches of rainfall, 1.54 inches below normal. The maximum rainfall in a single day was 0.36 inches, recorded on February 20. There were 7 days of rain >.01 in, 0 >.10 in, and 0 > 1 in.
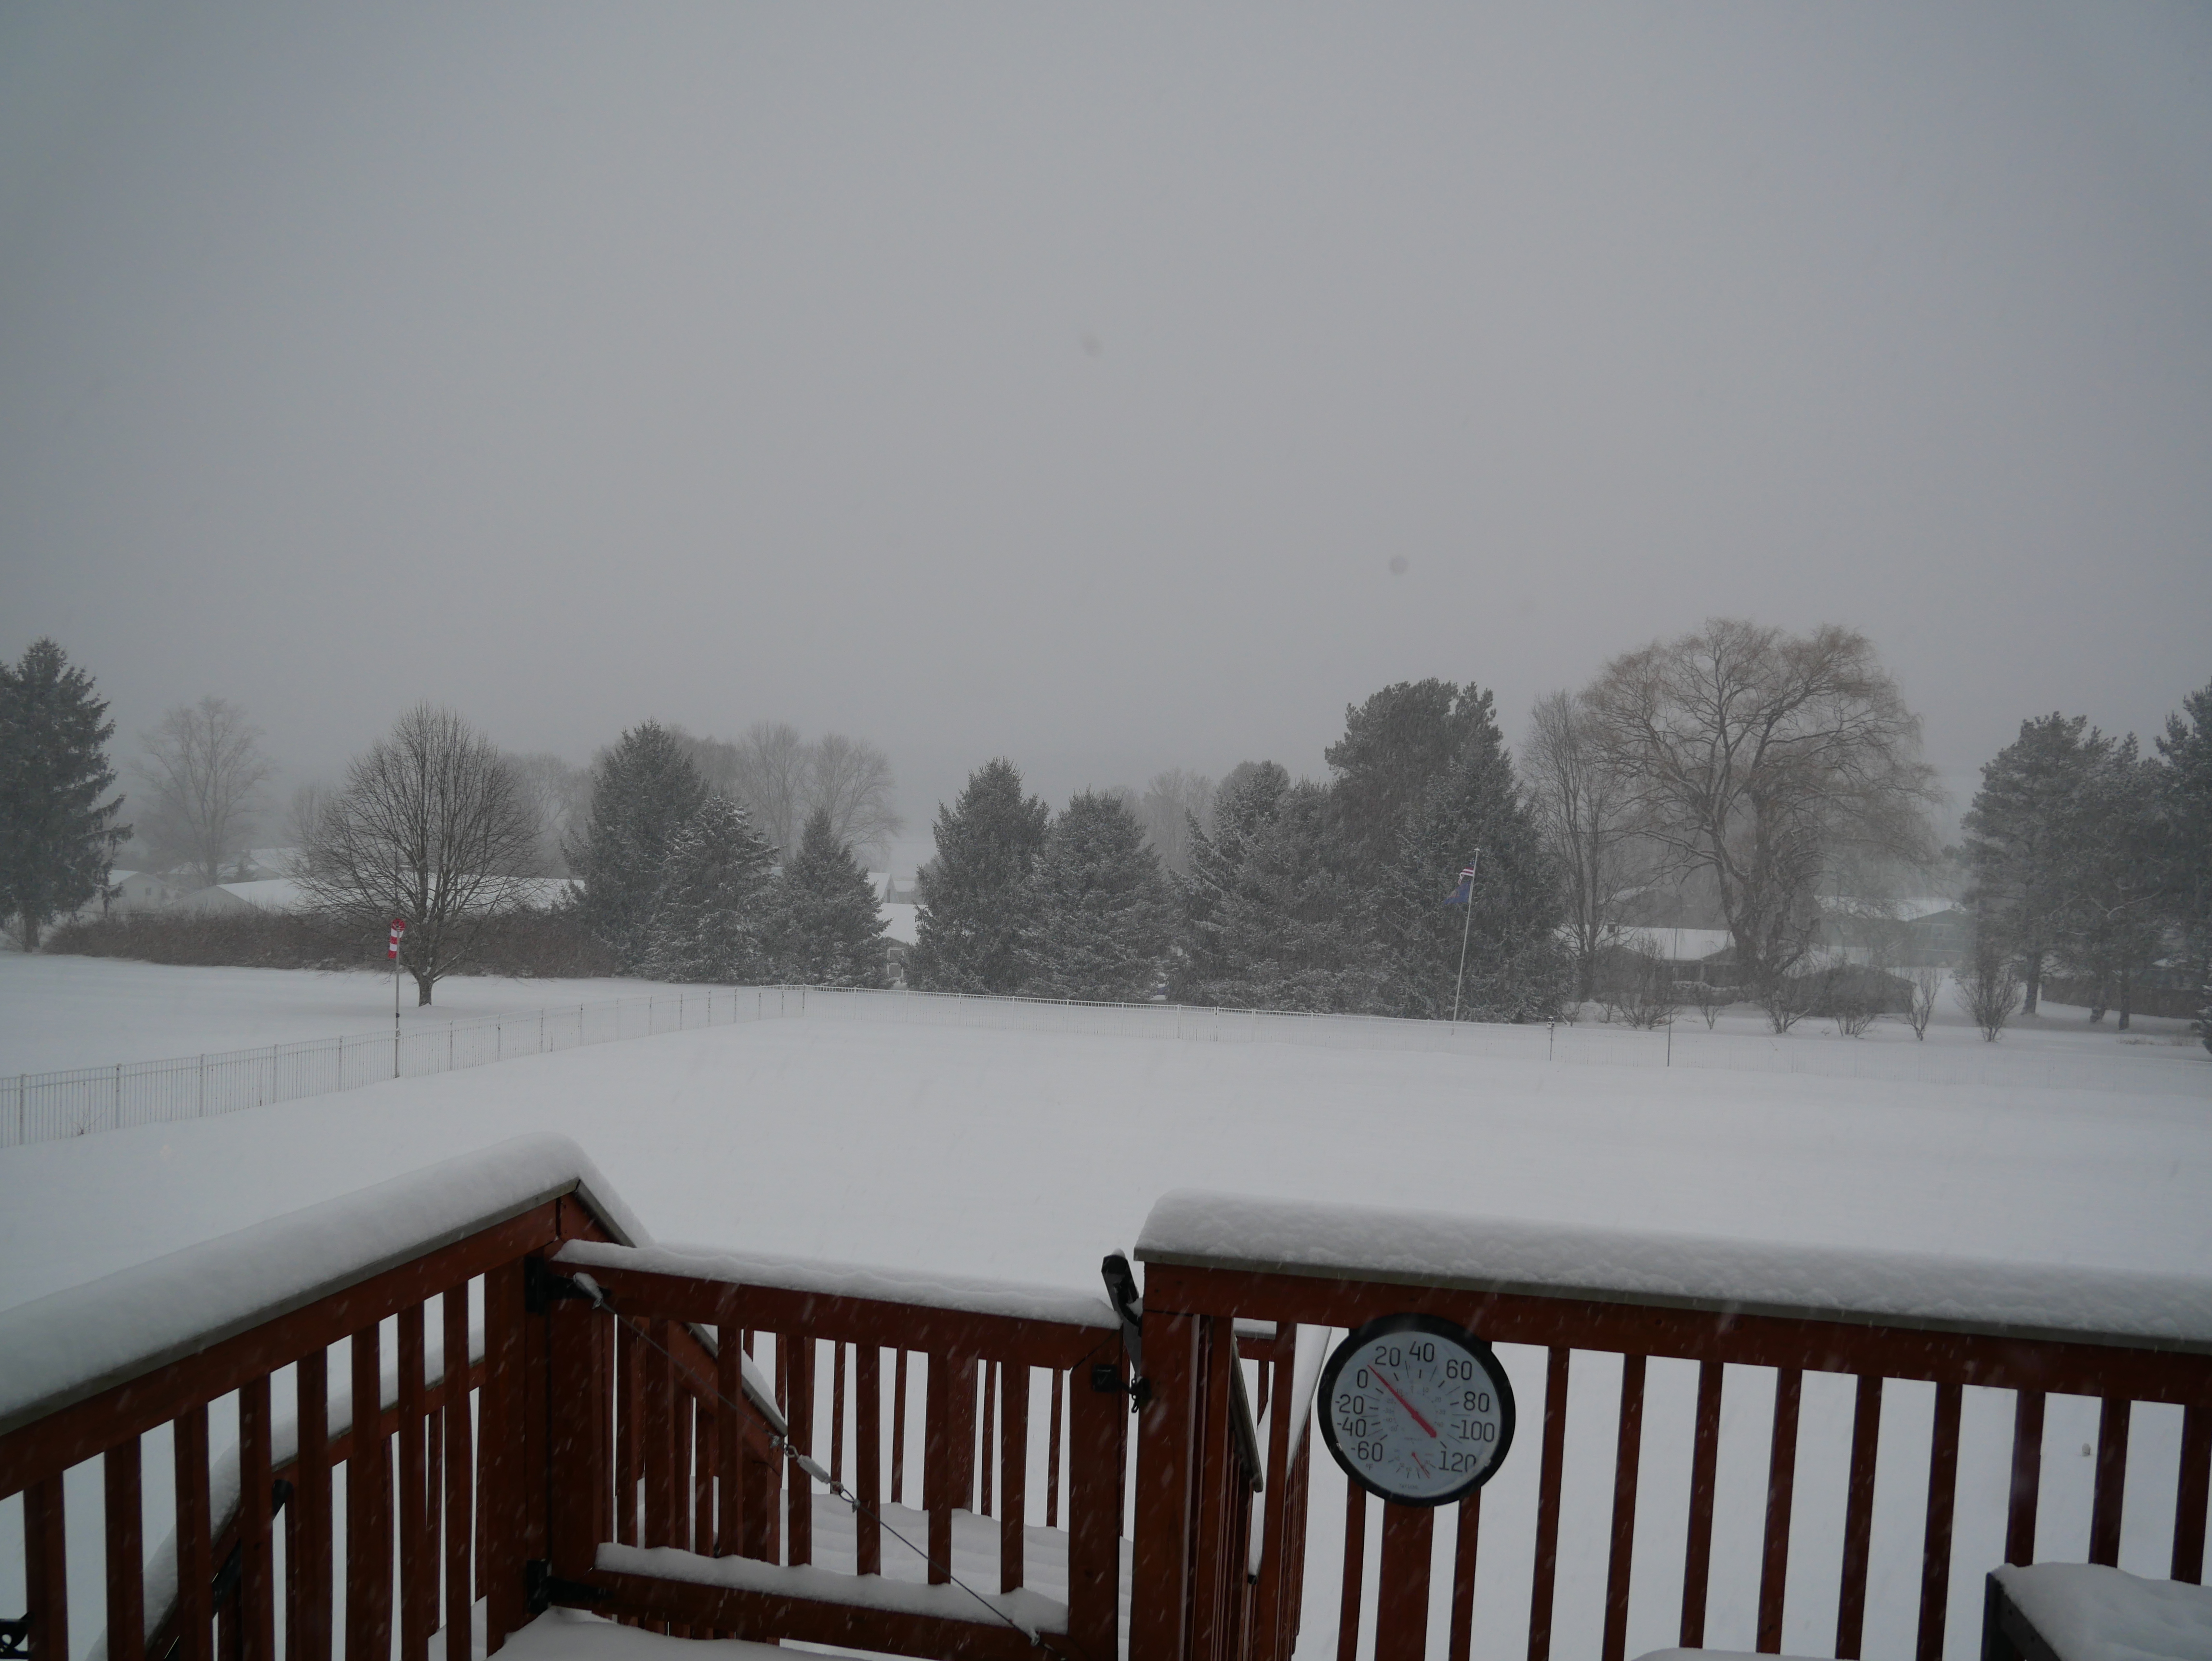
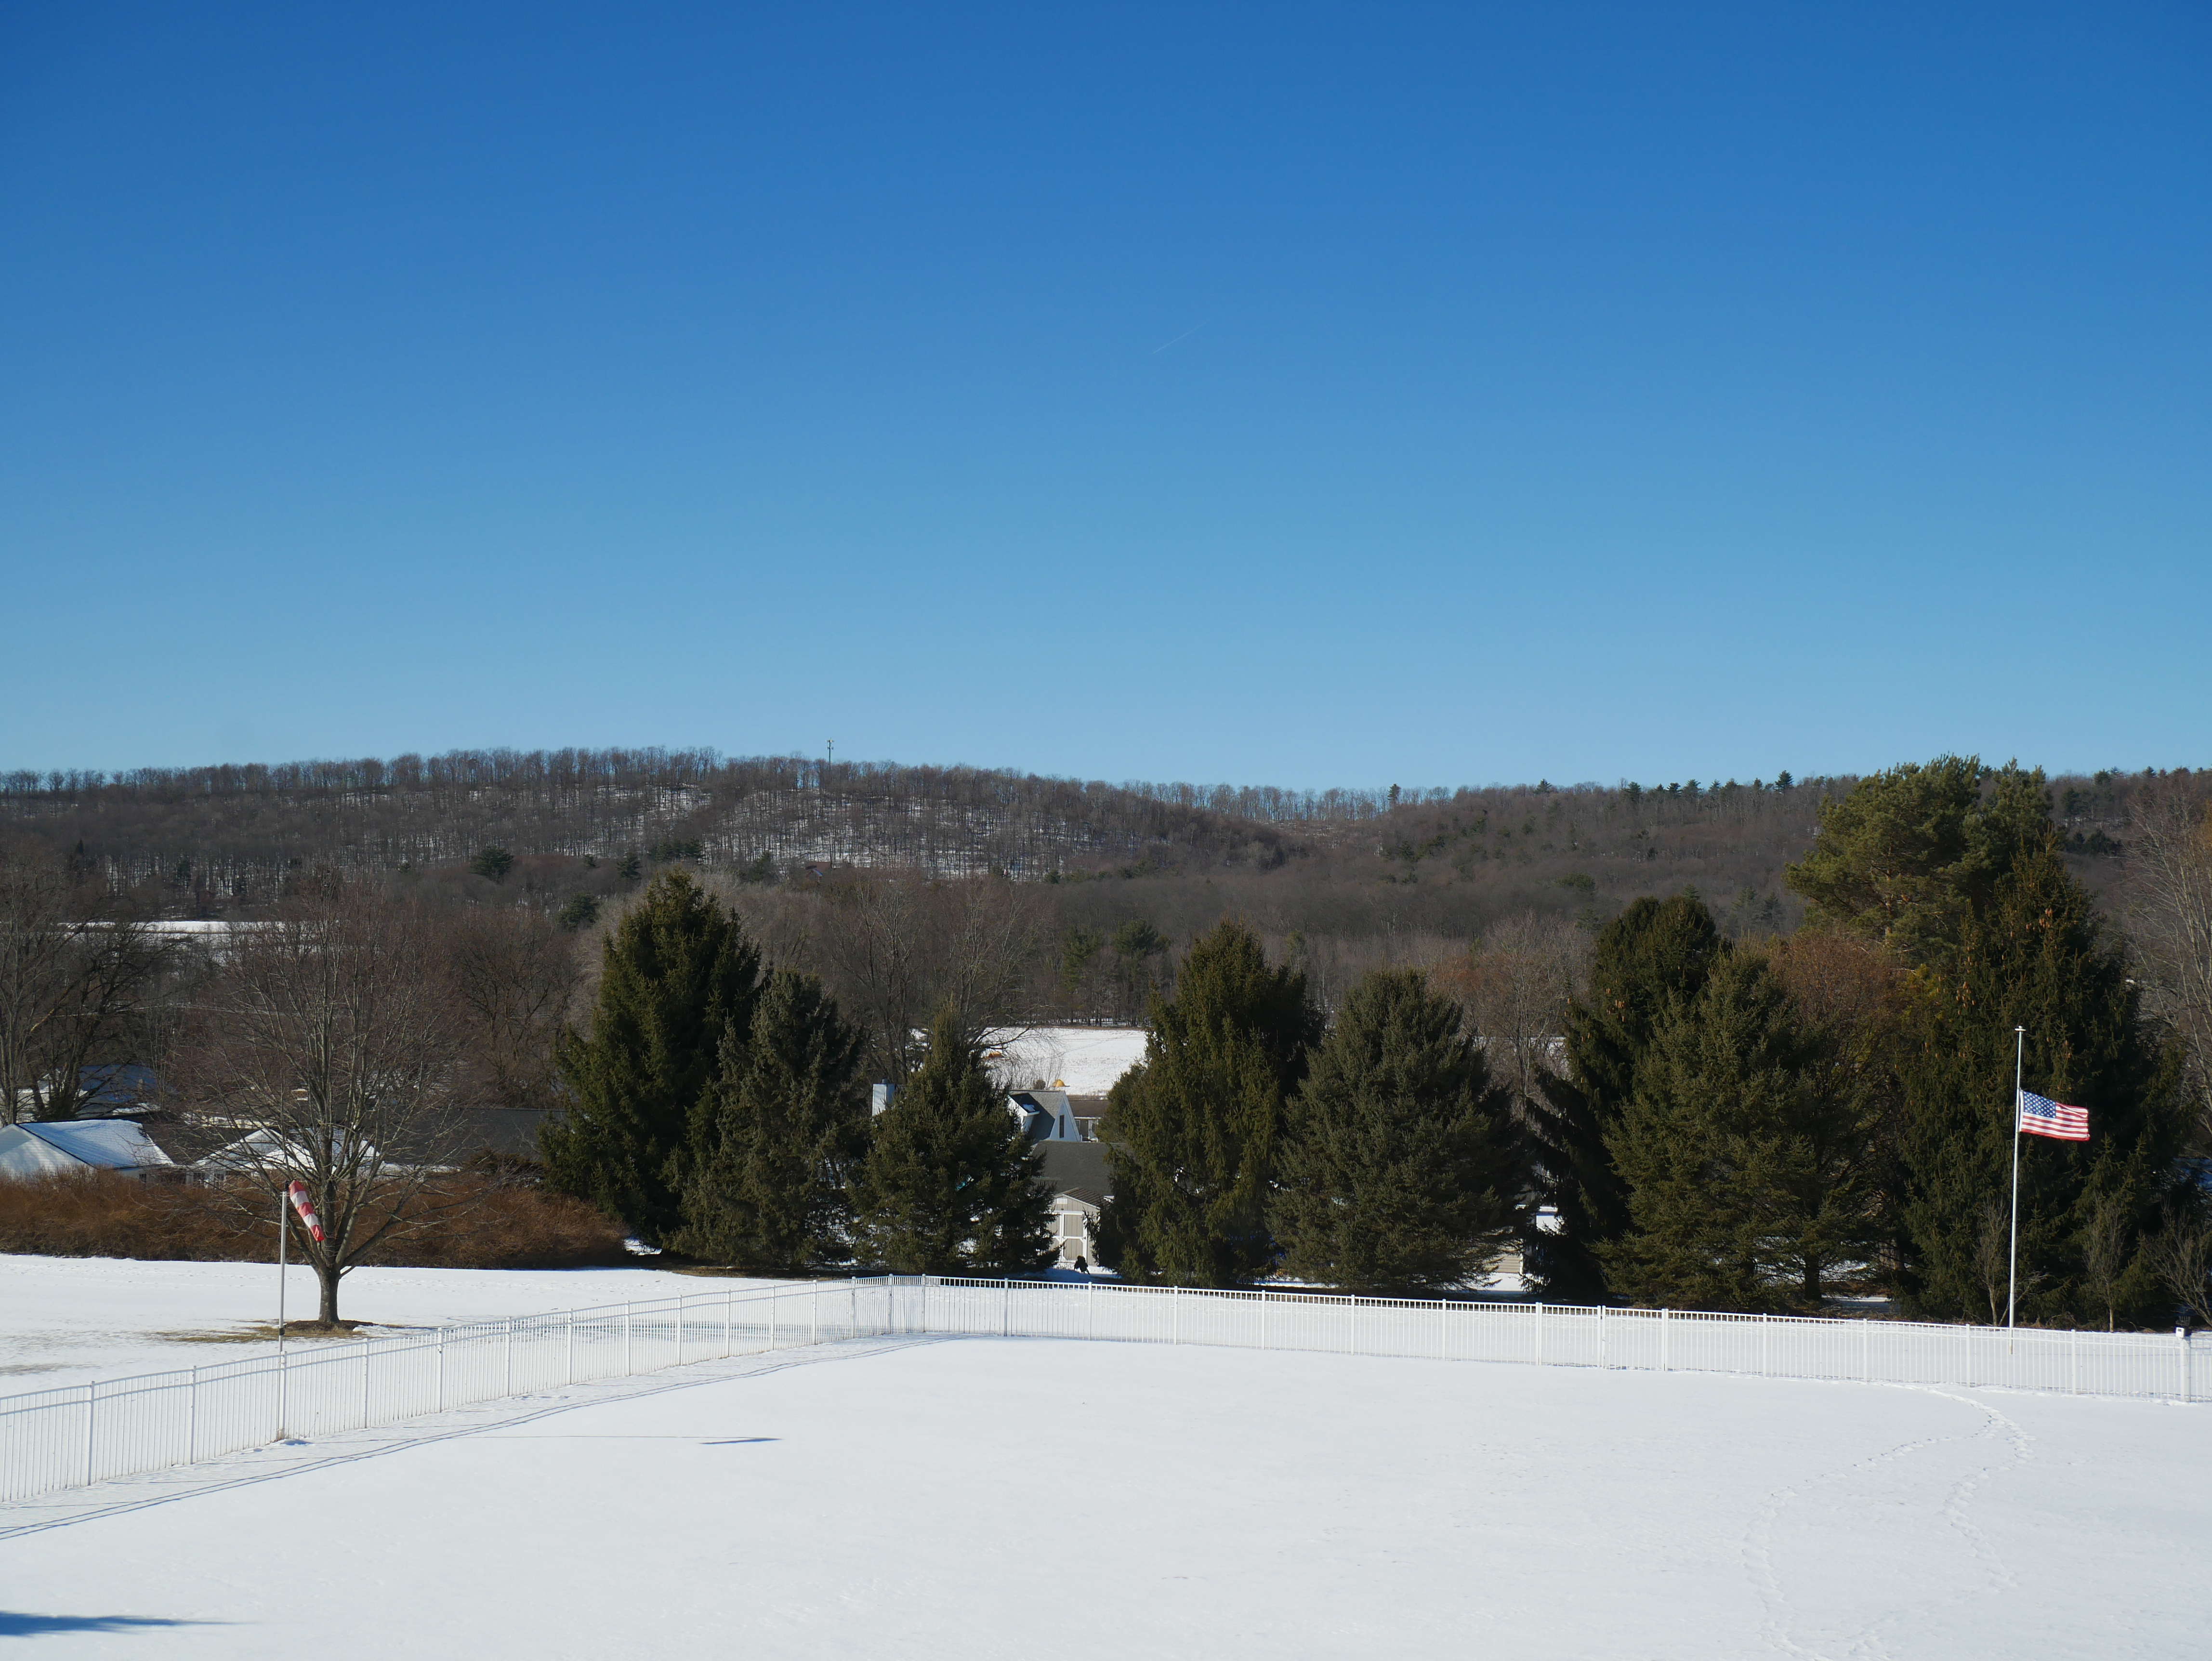
There were 5.0 inches of snow for the month, with a maximum daily total of 2.4 inches on February 23.
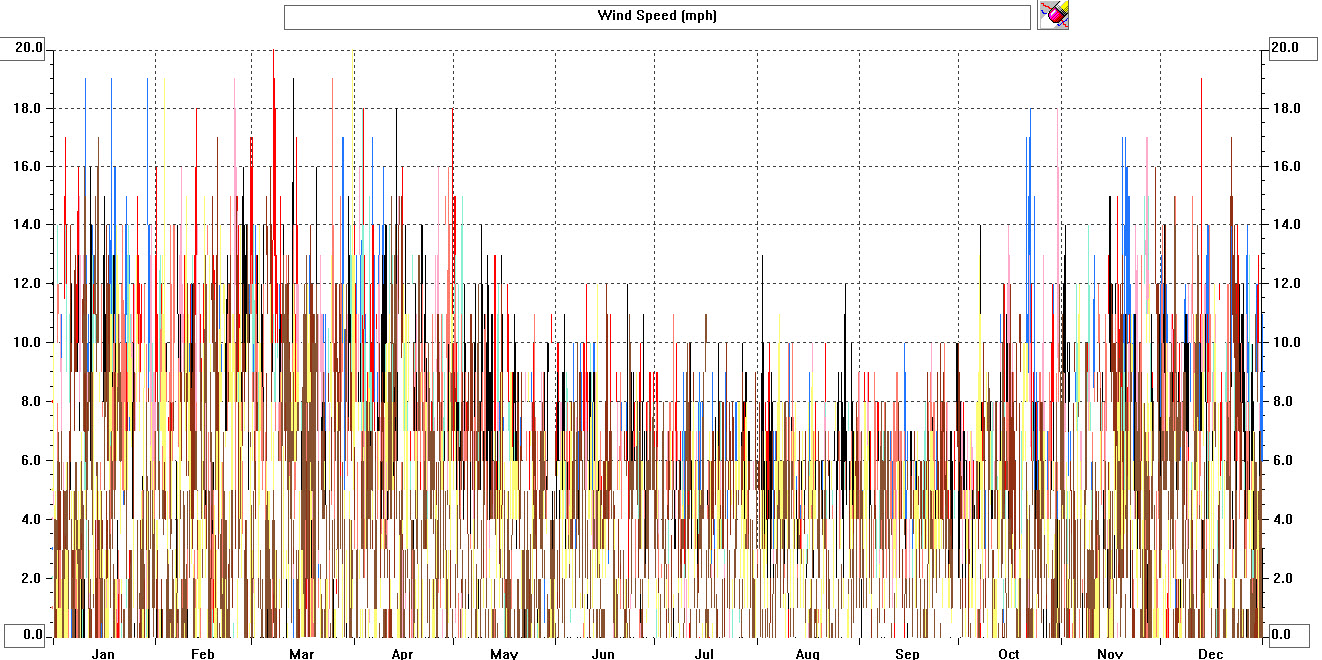
High wind speed of 37 mph on February 7.
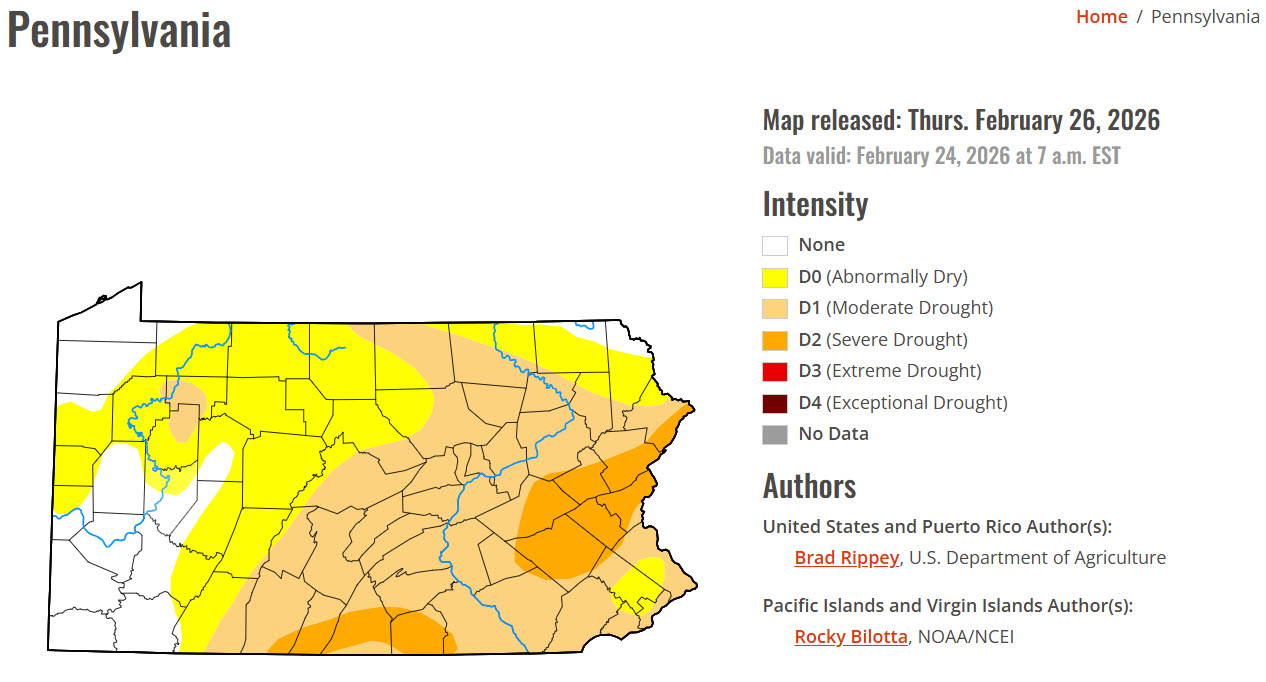
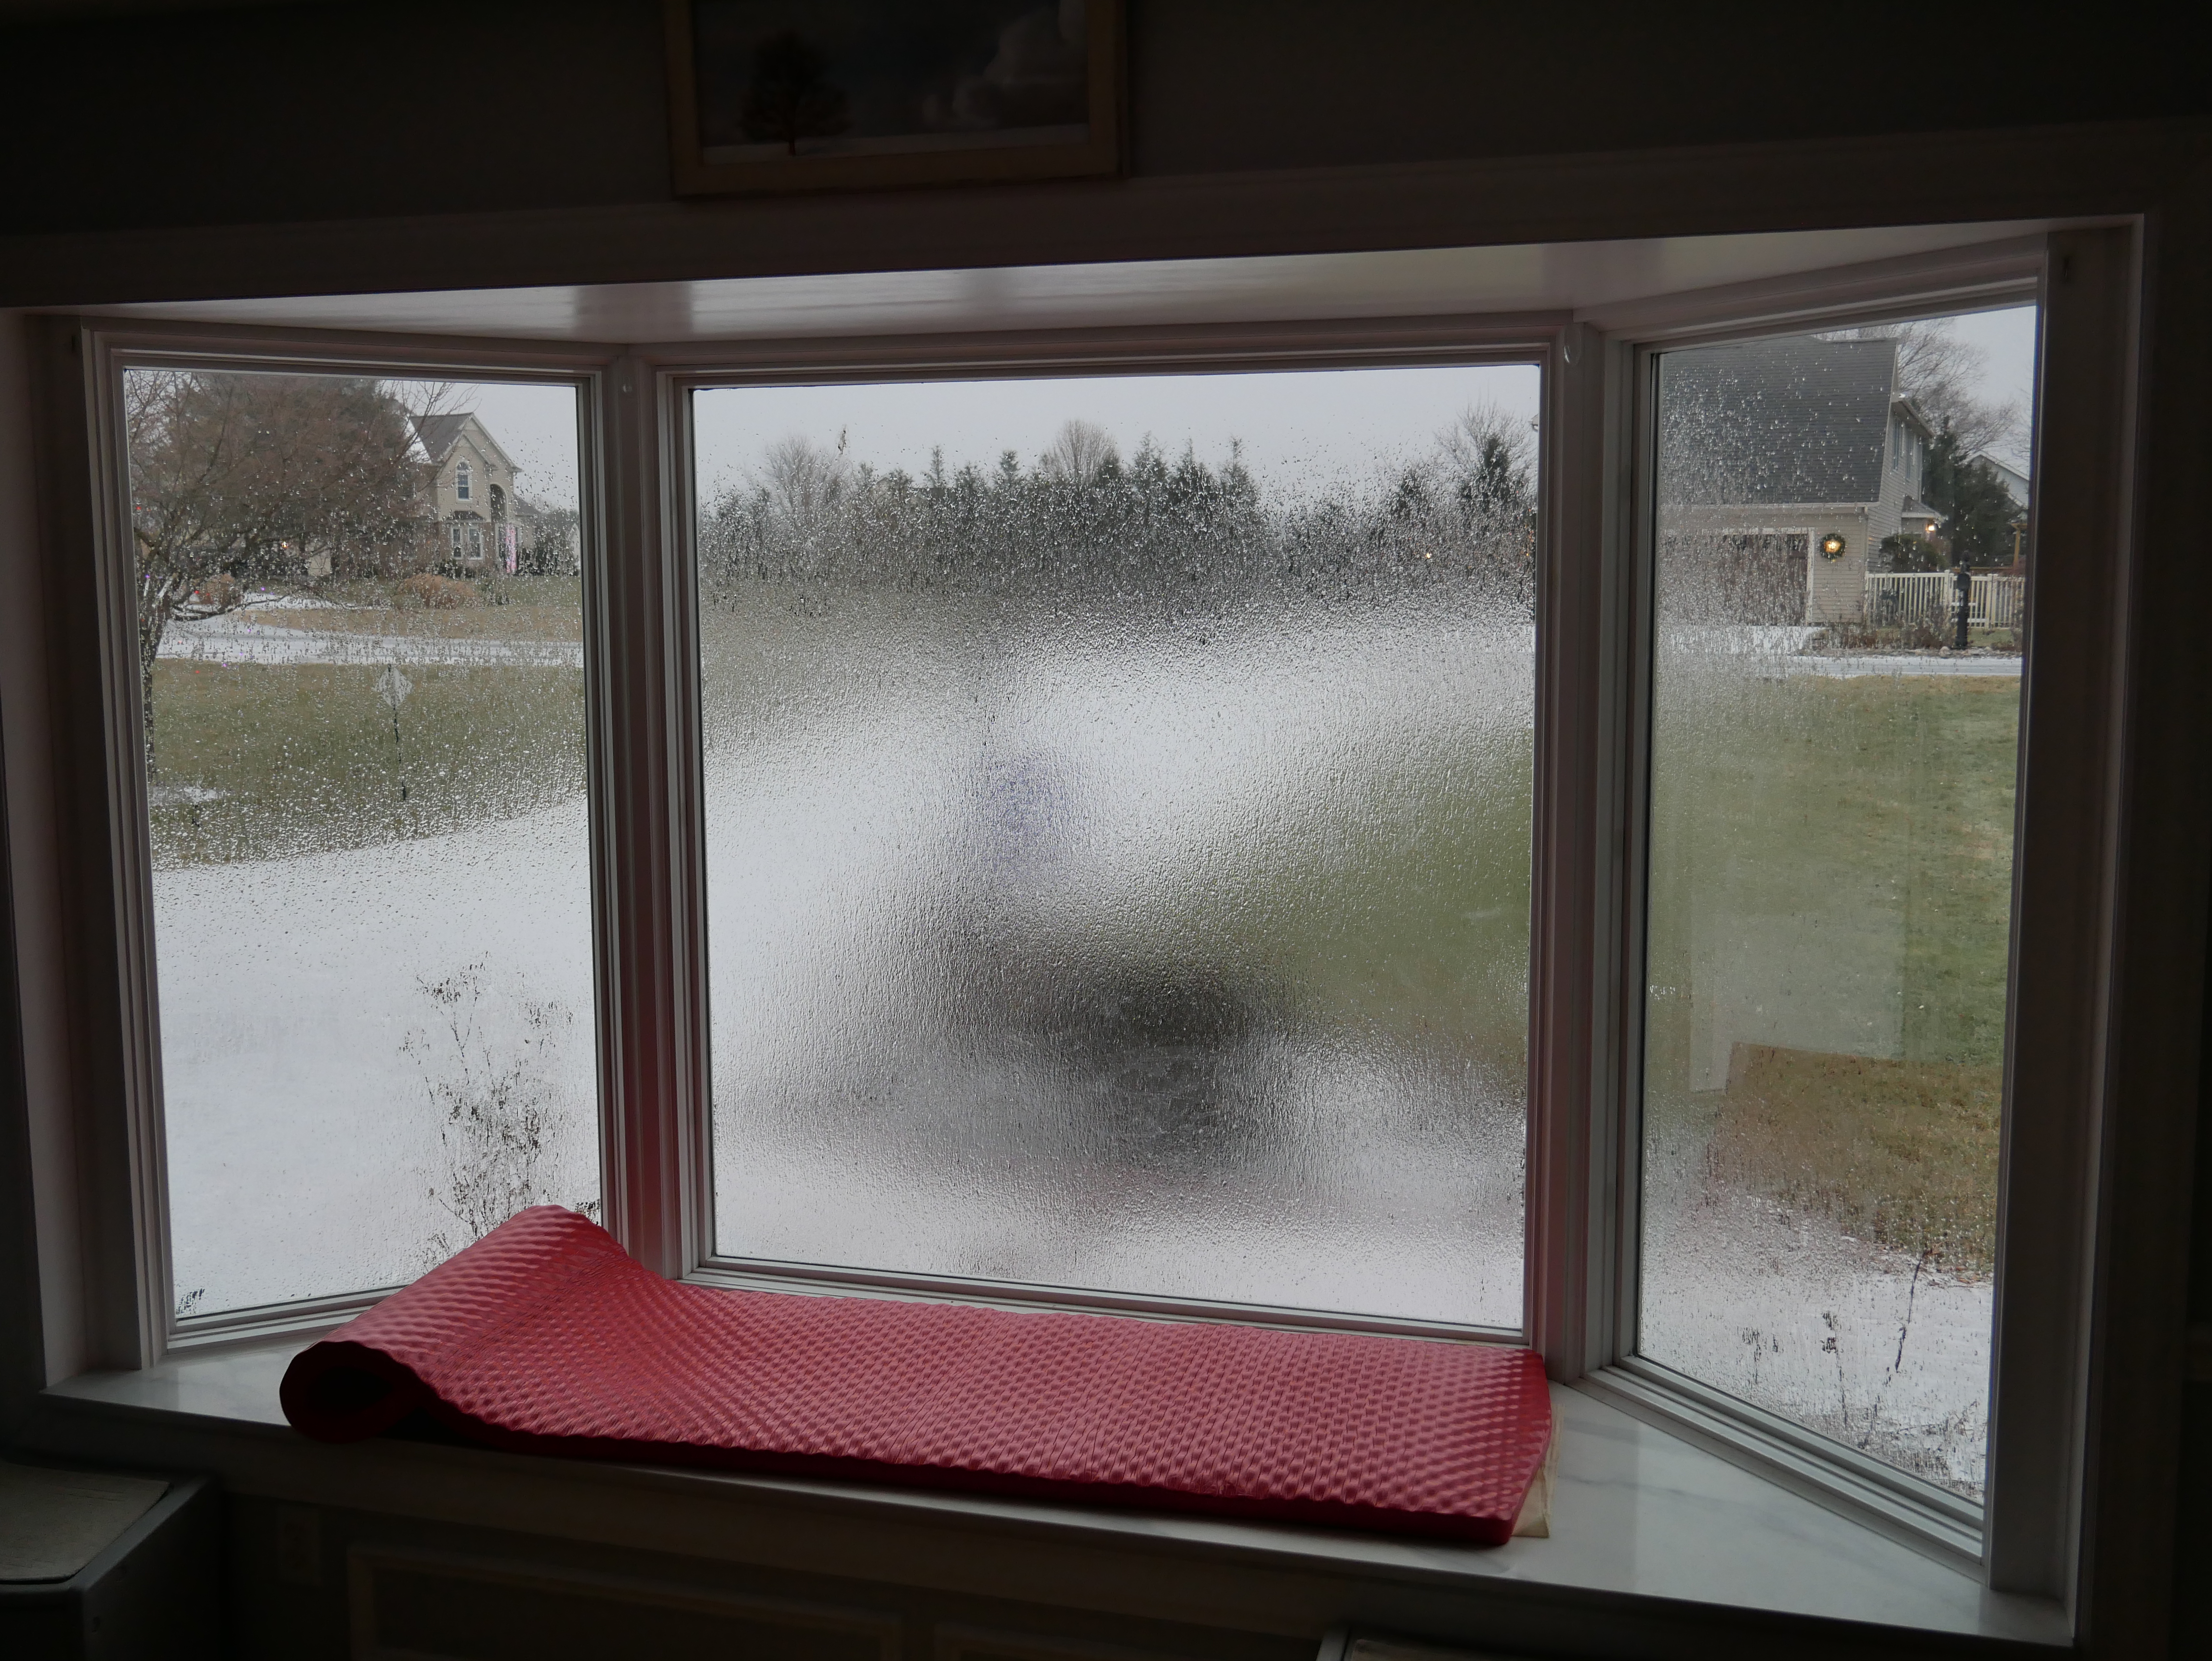
Most of Centre County has been experiencing moderate drought conditions as of February 24.
January was 3.7°F below normal for temperature. The highest temperature of the month was 54.9 F, recorded on January 9. The low for the month was -3.7 deg F, recorded on January 22. There were 17 days when the maximum was at or below 32 F, 27 days when the minimum temperature was at or below 32 F, and 3 days when the minimum temperature was at or below 0 F. There were 1281 heating degree days and 0 cooling degree days.
January was a below-normal month for precipitation, with 2.29 inches of liquid precipitation recorded, which was 0.63 inches below normal. The maximum liquid precipitation in a single day was 0.47 inches, recorded on January 31. There were 7 days of rain >.01 in, 4 >.10 in, and 1 > 1 in.
There were 20.9 inches of snow for the month, with a maximum daily total of 15.5 inches on January 25.
High wind speed of 39 mph on January 11.
As of January 1, 2026, my personal weather station at my home in Stormstown, PA, has collected 10 years of weather data.
Link to tabular data (2017-2025) – 2016 data are also available upon request.
Graphics:
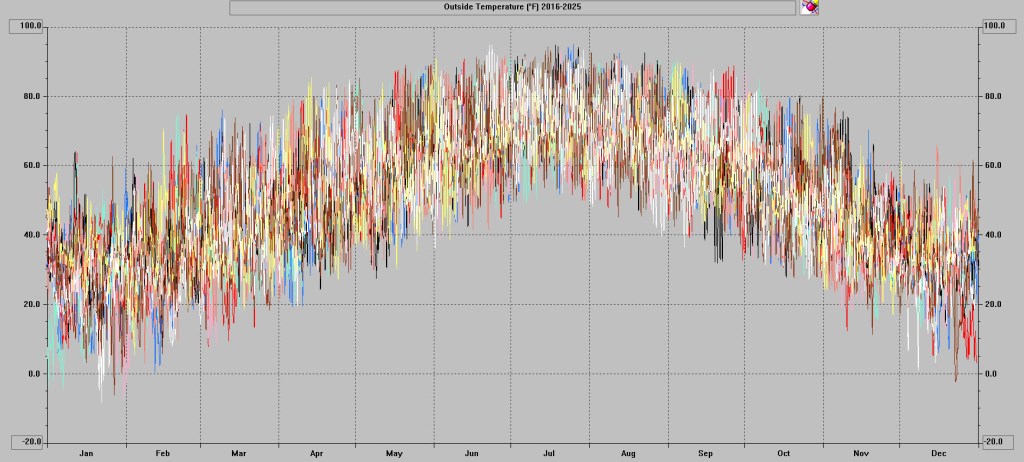

Overall, the year’s temperatures were near normal. The annual mean of 50.4 F was 0.1 F above normal. The annual precipitation of 42.71 inches was 1.18 inches above normal.
2025 Weather Data
January
January was the coldest month of 2025 and with a monthly mean of 23.7.7 F, which was 3.5 F below normal, with a high of 44.8 F and a low for the month of -8.7 F. Precipitation was 1.46 inches below normal with 1.46 inches of liquid precipitation. There were 9.3 inches of snow for the month, with a maximum daily total of 2.4 inches on January 4.
High wind speed of 37 mph on January 29.
February

February was a near-normal month for temperature, with a mean of 29.4 F, which was 0.3 F above normal. The high was 53.8 F, and the low was 7.9 F. Precipitation was 0.42 inches above normal at 2.88 inches. There were 5.4 inches of snow for the month, with a maximum daily total of 1.6 inches on February 16.
High wind speed of 40 mph on February 16.
March

March temperatures were 6.5 F above normal with a mean of 43.5 F. The high was 74.8 F, and the low was 14.1 F. Precipitation was 1.17 inches below normal with 2.21 inches of liquid precipitation. There was no measurable snow accumulation. There was 0.3″ of snow accumulation.
The highest recorded wind speed was 46 mph.
April

Temperatures were 2.4 F above normal in April with a mean temperature of 51.7 F. The high was 85.0 F, and the low was 19.4 F. Rainfall was 0.57 inches above normal at 4.08 inches.
There was a trace of snow in April.
High wind speed of 49 mph on April 29.
May

Temperatures were 1.3 F below normal with a mean temperature of 58.5 F. The high was 78.7 F, and the low was 36.9°F. Precipitation was 8.25 inches, 4.61 inches above normal. May was the rainiest month of 2025.
The high wind speed was 34 mph.
June

Temperatures for the month were 2.1 F above normal with a mean of 70.2 F. The high for the month was 95 F and the low was 36 F. Precipitation was 1.72 inches above normal, with 5.81 inches of rainfall.
The high wind speed was 35 mph.
July

July was the warmest month, and temperatures were 2.3 F above normal with a mean of 74.5 F. The high for the month was 93.7 F, and the low was 52.2 F. Rainfall was 1.51 inches above normal, with 5.30 inches of precipitation.
The high wind speed was 25 mph.
August

August temperatures were 3.1 F below normal with a mean of 67.3 F. The high was 90.8 F, and the low was 39.4 F. Precipitation was 2.32 inches below normal at 1.84 inches.
The high wind speed was 23 mph.
September
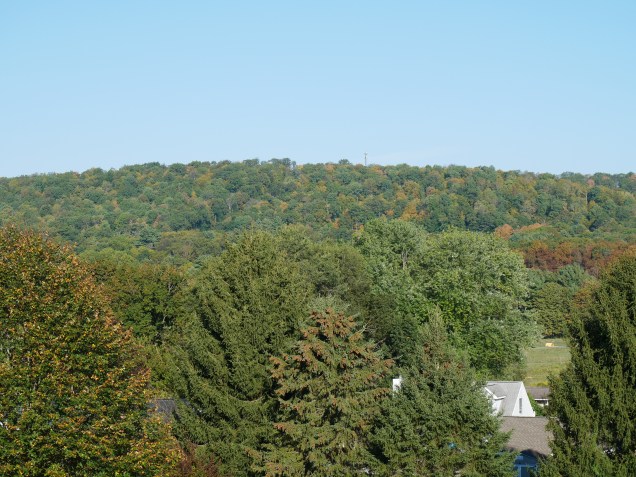
Temperatures were 0.7 F above normal with a mean of 63.9 F. The high was 88.5 F, and the low was 36.5 F. There were 3.46 inches of rainfall, which was 0.49 inches below normal.
High wind speed was 28 mph.
October

October was near normal with temperatures at 0.3 F below normal, with a mean of 51.6 F. The high was 81.6 F and the low was 27.2 F. Rainfall was 3.26 inches, which was 0.20 inches below normal.
The high wind speed was 32 mph.
November

Temperatures in November were near-normal at 0.6 F below normal with a mean of 40.6 F. The high was 67.9 F and the low was 23.4 F. Precipitation was 2.24 inches, 0.75 inches below normal. The first snowfall of the season was on November 11.
The high wind speed was 39 mph.
December
December temperatures were 3.8 F below normal, with a mean temperature of 28.4 F. The high for the month was 54.3 F deg. F, and the low was 1.1 F. Precipitation with 1.92 inches of liquid precipitation recorded, which was 1.26 inches below normal. There were 7.8 inches of snowfall.
The high wind speed was 51 mph.
2025 Stormstown Insolation

Meteorological Autumn is officially over. Here is a brief summary of September 1-November 30 in Stormstown, PA:
Number of days Max T >= 90 F: 0
Number of Days Max T <= 32 F: 0
Number of Days Min T <= 32 F: 21
The first freeze of the season occurred on October 10.
Max T: 88.5 F – September 19, 2025
Min T: 23.4 F – November 18, 2025
Sep Dep from Normal: 0.7 F
Oct Dep from Normal: -0.3 F
Nov Dep from Normal: -0.6 F
Heating Degree Days: 1305
Cooling Degree Days: 124
Sep Precip: 3.46″, 0.49″ below normal
Oct Precip: 3.26″, 0.20″ below normal
Nov Precip: 2.24″, 0.75″ below normal
The first snowfall of the season occurred on November 11.

November was 0.6 deg F below normal for temperature. The high for the month was 67.9 deg. F, recorded on November 5. The low for the month was 23.6 deg F, recorded on November 18. There were 16 days at or below 32 F. There were 731 heating degree days and 0 cooling degree days.
November was a below-normal month for precipitation with 2.24 inches of rainfall recorded, 0.75 inches below normal. The maximum rainfall in a single day was 0.52 inches recorded on November 11. There were 11 days of rain >.01 in, 6 >.10 in, and 0 > 1 in.
The first snowfall of the season was on November 11.
High wind speed of 39 mph on November 5.
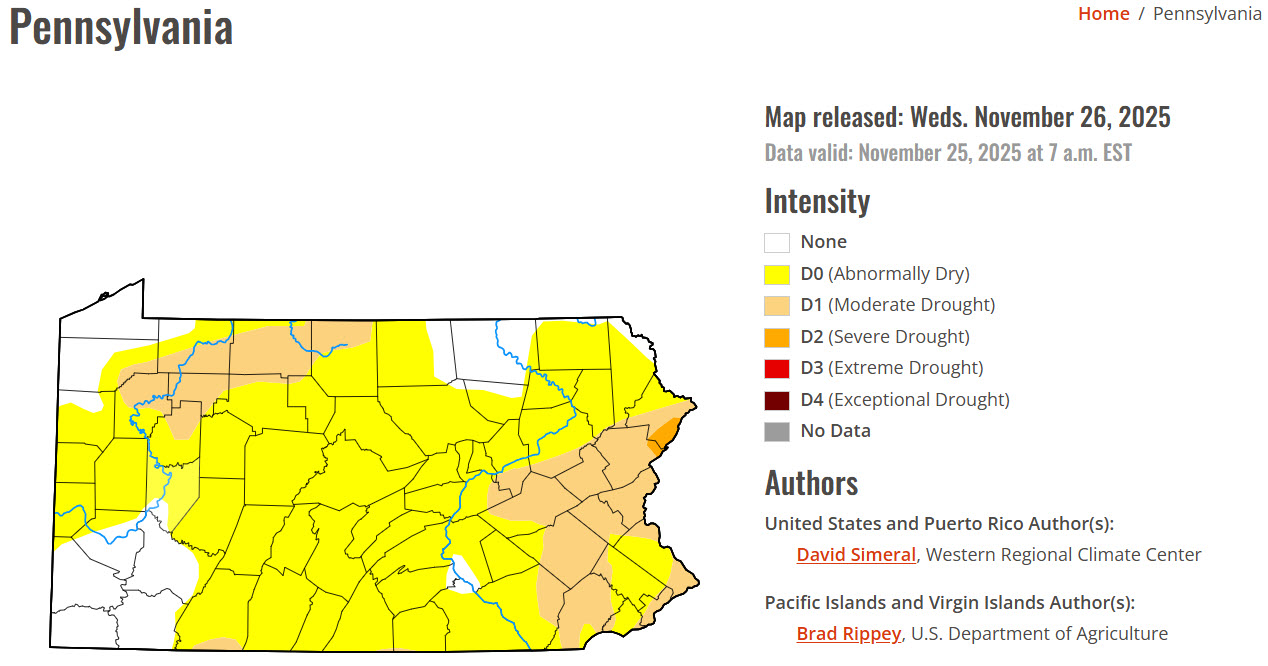
Current Drought Data
October was 0.3 deg F below normal for temperature. The high for the month was 81.6 deg. F recorded on October 6. The low for the month was 27.2 deg F, recorded on Oct 27. The first freeze of the season, 31.4 F, was recorded on October 10. There were 0 days at or above 90 deg F and 5 days at or below 32 deg F. There were 436 heating degree days and 20 cooling degree days.
October was below average for precipitation with 3.26 inches of rainfall recorded, which was 0.20 inches below normal. The maximum rainfall in a single day was 1.47 inches recorded on October 30. There were 8 days of rain >.01 in, 6 >.10 in and 1 > 1 inch.
High wind speed of 32 mph on October 31.
Drought Status

July was 2.3 F above normal for temperature. The high for the month was 93.7 deg. F recorded on July 30. The low for the month was 52.2 deg F, recorded on July 22. There were 6 days at or above 90 deg F. There were 15 heating degree days and 311 cooling degree days.
July was an above-normal month for precipitation, with 5.30 inches of rainfall recorded, which was 1.51 inches above normal. The maximum rainfall in a single day was 1.79 inches recorded on July 26. There were 9 days of rain >.01 in, 9 >.10 in, and 1 >1 in.
High wind speed of 25 mph on July 17.
