Meteorological Autumn is officially over. Here is a brief summary of September 1-November 30 in Stormstown, PA:
Number of days Max T >= 90 F: 0
Number of Days Max T <= 32 F: 1
Number of Days Min T <= 32 F: 17
The first freeze of the season occurred on October 15.
Max T: 83.9 F – September 1, 2024
Min T: 20.9 F – November 30, 2024
Sep Dep from Normal: 0.3 F
Oct Dep from Normal: 1.4 F
Nov Dep from Normal: 3.1 F
Heating Degree Days: 1133
Cooling Degree Days: 108
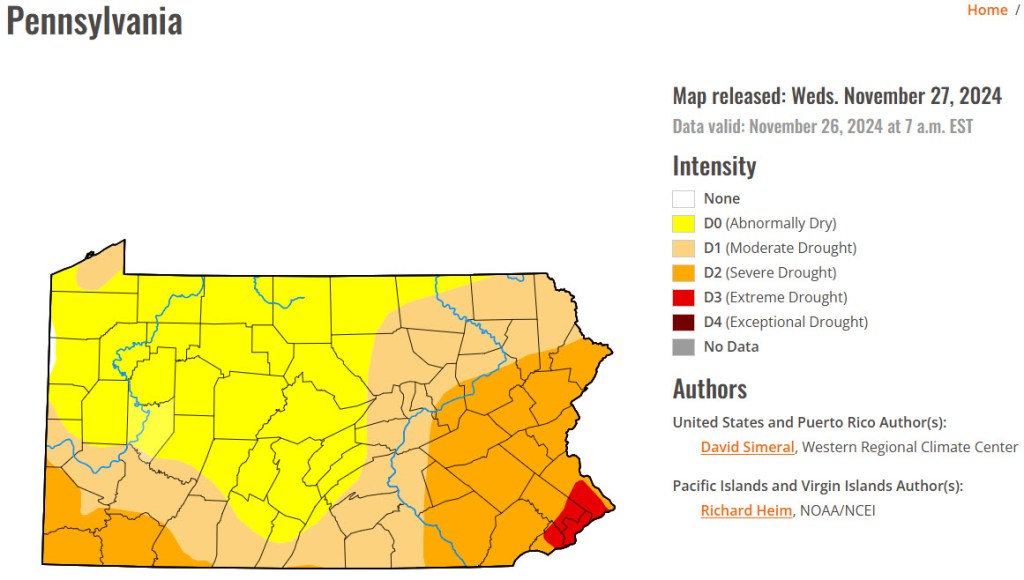
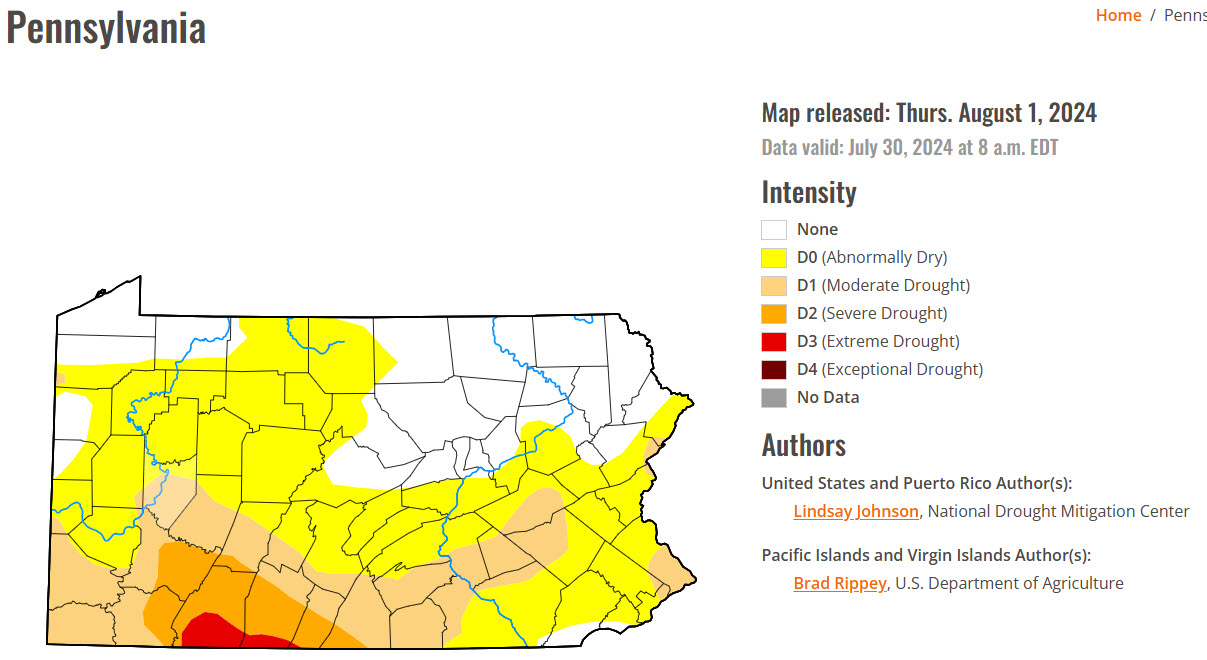
Sep Precip: 1.94″, 2.01″ below normal
Oct Precip: 0.95″, 1.13″ below normal
Nov Precip: 2.55″, 0.44″ below normal
The first snowfall of the season occurred on November 22.