Overall, the year’s temperatures were near normal. The annual mean of 50.4 F was 0.1 F above normal. The annual precipitation of 42.71 inches was 1.18 inches above normal.
2025 Weather Data
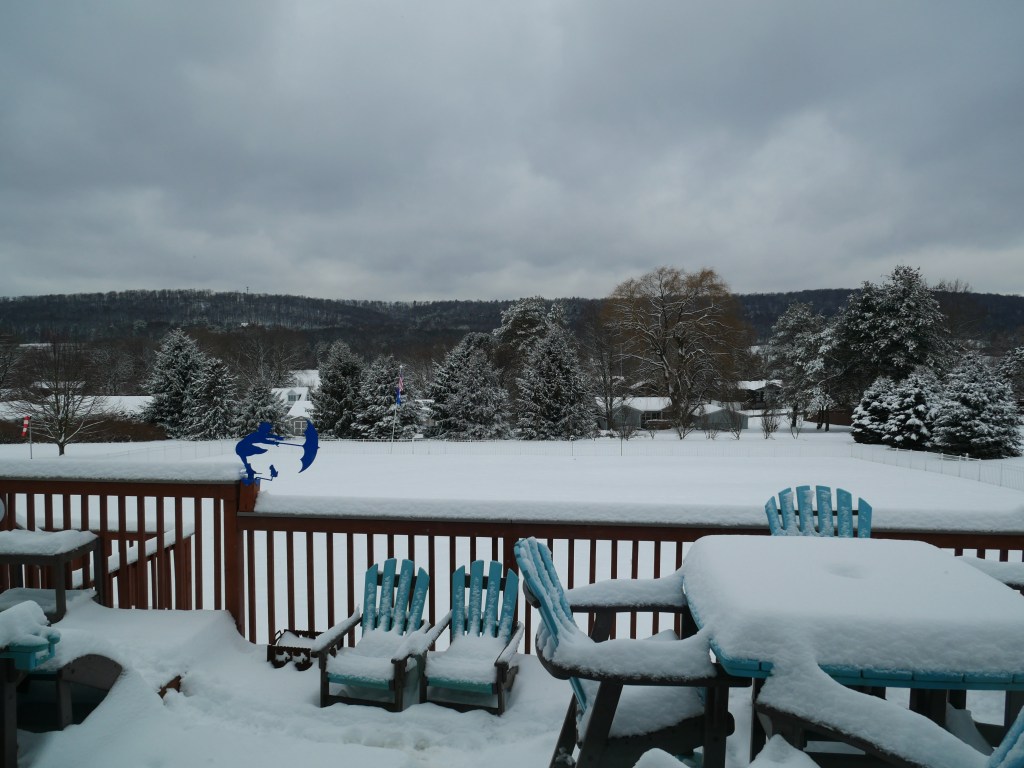
January
January was the coldest month of 2025 and with a monthly mean of 23.7.7 F, which was 3.5 F below normal, with a high of 44.8 F and a low for the month of -8.7 F. Precipitation was 1.46 inches below normal with 1.46 inches of liquid precipitation. There were 9.3 inches of snow for the month, with a maximum daily total of 2.4 inches on January 4.
High wind speed of 37 mph on January 29.
February

February was a near-normal month for temperature, with a mean of 29.4 F, which was 0.3 F above normal. The high was 53.8 F, and the low was 7.9 F. Precipitation was 0.42 inches above normal at 2.88 inches. There were 5.4 inches of snow for the month, with a maximum daily total of 1.6 inches on February 16.
High wind speed of 40 mph on February 16.
March

March temperatures were 6.5 F above normal with a mean of 43.5 F. The high was 74.8 F, and the low was 14.1 F. Precipitation was 1.17 inches below normal with 2.21 inches of liquid precipitation. There was no measurable snow accumulation. There was 0.3″ of snow accumulation.
The highest recorded wind speed was 46 mph.
April

Temperatures were 2.4 F above normal in April with a mean temperature of 51.7 F. The high was 85.0 F, and the low was 19.4 F. Rainfall was 0.57 inches above normal at 4.08 inches.
There was a trace of snow in April.
High wind speed of 49 mph on April 29.
May
Temperatures were 1.3 F below normal with a mean temperature of 58.5 F. The high was 78.7 F, and the low was 36.9°F. Precipitation was 8.25 inches, 4.61 inches above normal. May was the rainiest month of 2025.
The high wind speed was 34 mph.
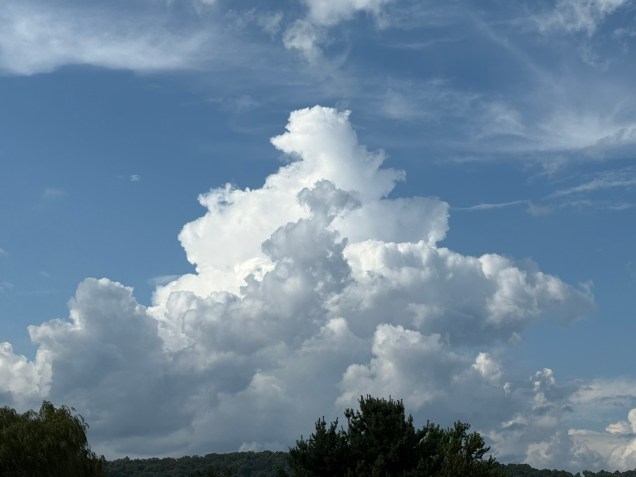
June

Temperatures for the month were 2.1 F above normal with a mean of 70.2 F. The high for the month was 95 F and the low was 36 F. Precipitation was 1.72 inches above normal, with 5.81 inches of rainfall.
The high wind speed was 35 mph.
July

July was the warmest month, and temperatures were 2.3 F above normal with a mean of 74.5 F. The high for the month was 93.7 F, and the low was 52.2 F. Rainfall was 1.51 inches above normal, with 5.30 inches of precipitation.
The high wind speed was 25 mph.
August
August temperatures were 3.1 F below normal with a mean of 67.3 F. The high was 90.8 F, and the low was 39.4 F. Precipitation was 2.32 inches below normal at 1.84 inches.
The high wind speed was 23 mph.
September
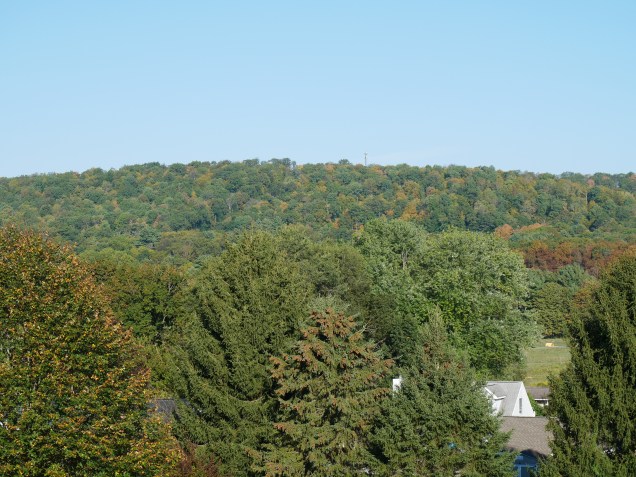
Temperatures were 0.7 F above normal with a mean of 63.9 F. The high was 88.5 F, and the low was 36.5 F. There were 3.46 inches of rainfall, which was 0.49 inches below normal.
High wind speed was 28 mph.
October
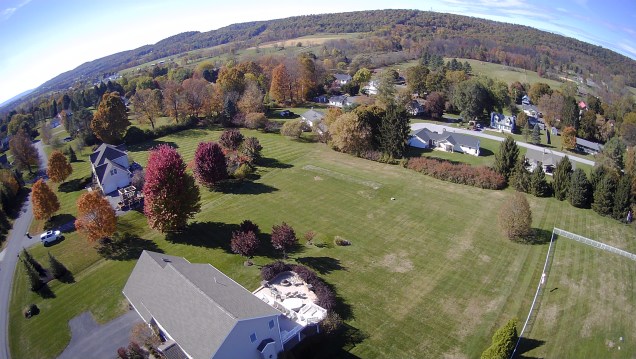
October was near normal with temperatures at 0.3 F below normal, with a mean of 51.6 F. The high was 81.6 F and the low was 27.2 F. Rainfall was 3.26 inches, which was 0.20 inches below normal.
The high wind speed was 32 mph.
November

Temperatures in November were near-normal at 0.6 F below normal with a mean of 40.6 F. The high was 67.9 F and the low was 23.4 F. Precipitation was 2.24 inches, 0.75 inches below normal. The first snowfall of the season was on November 11.
The high wind speed was 39 mph.
December
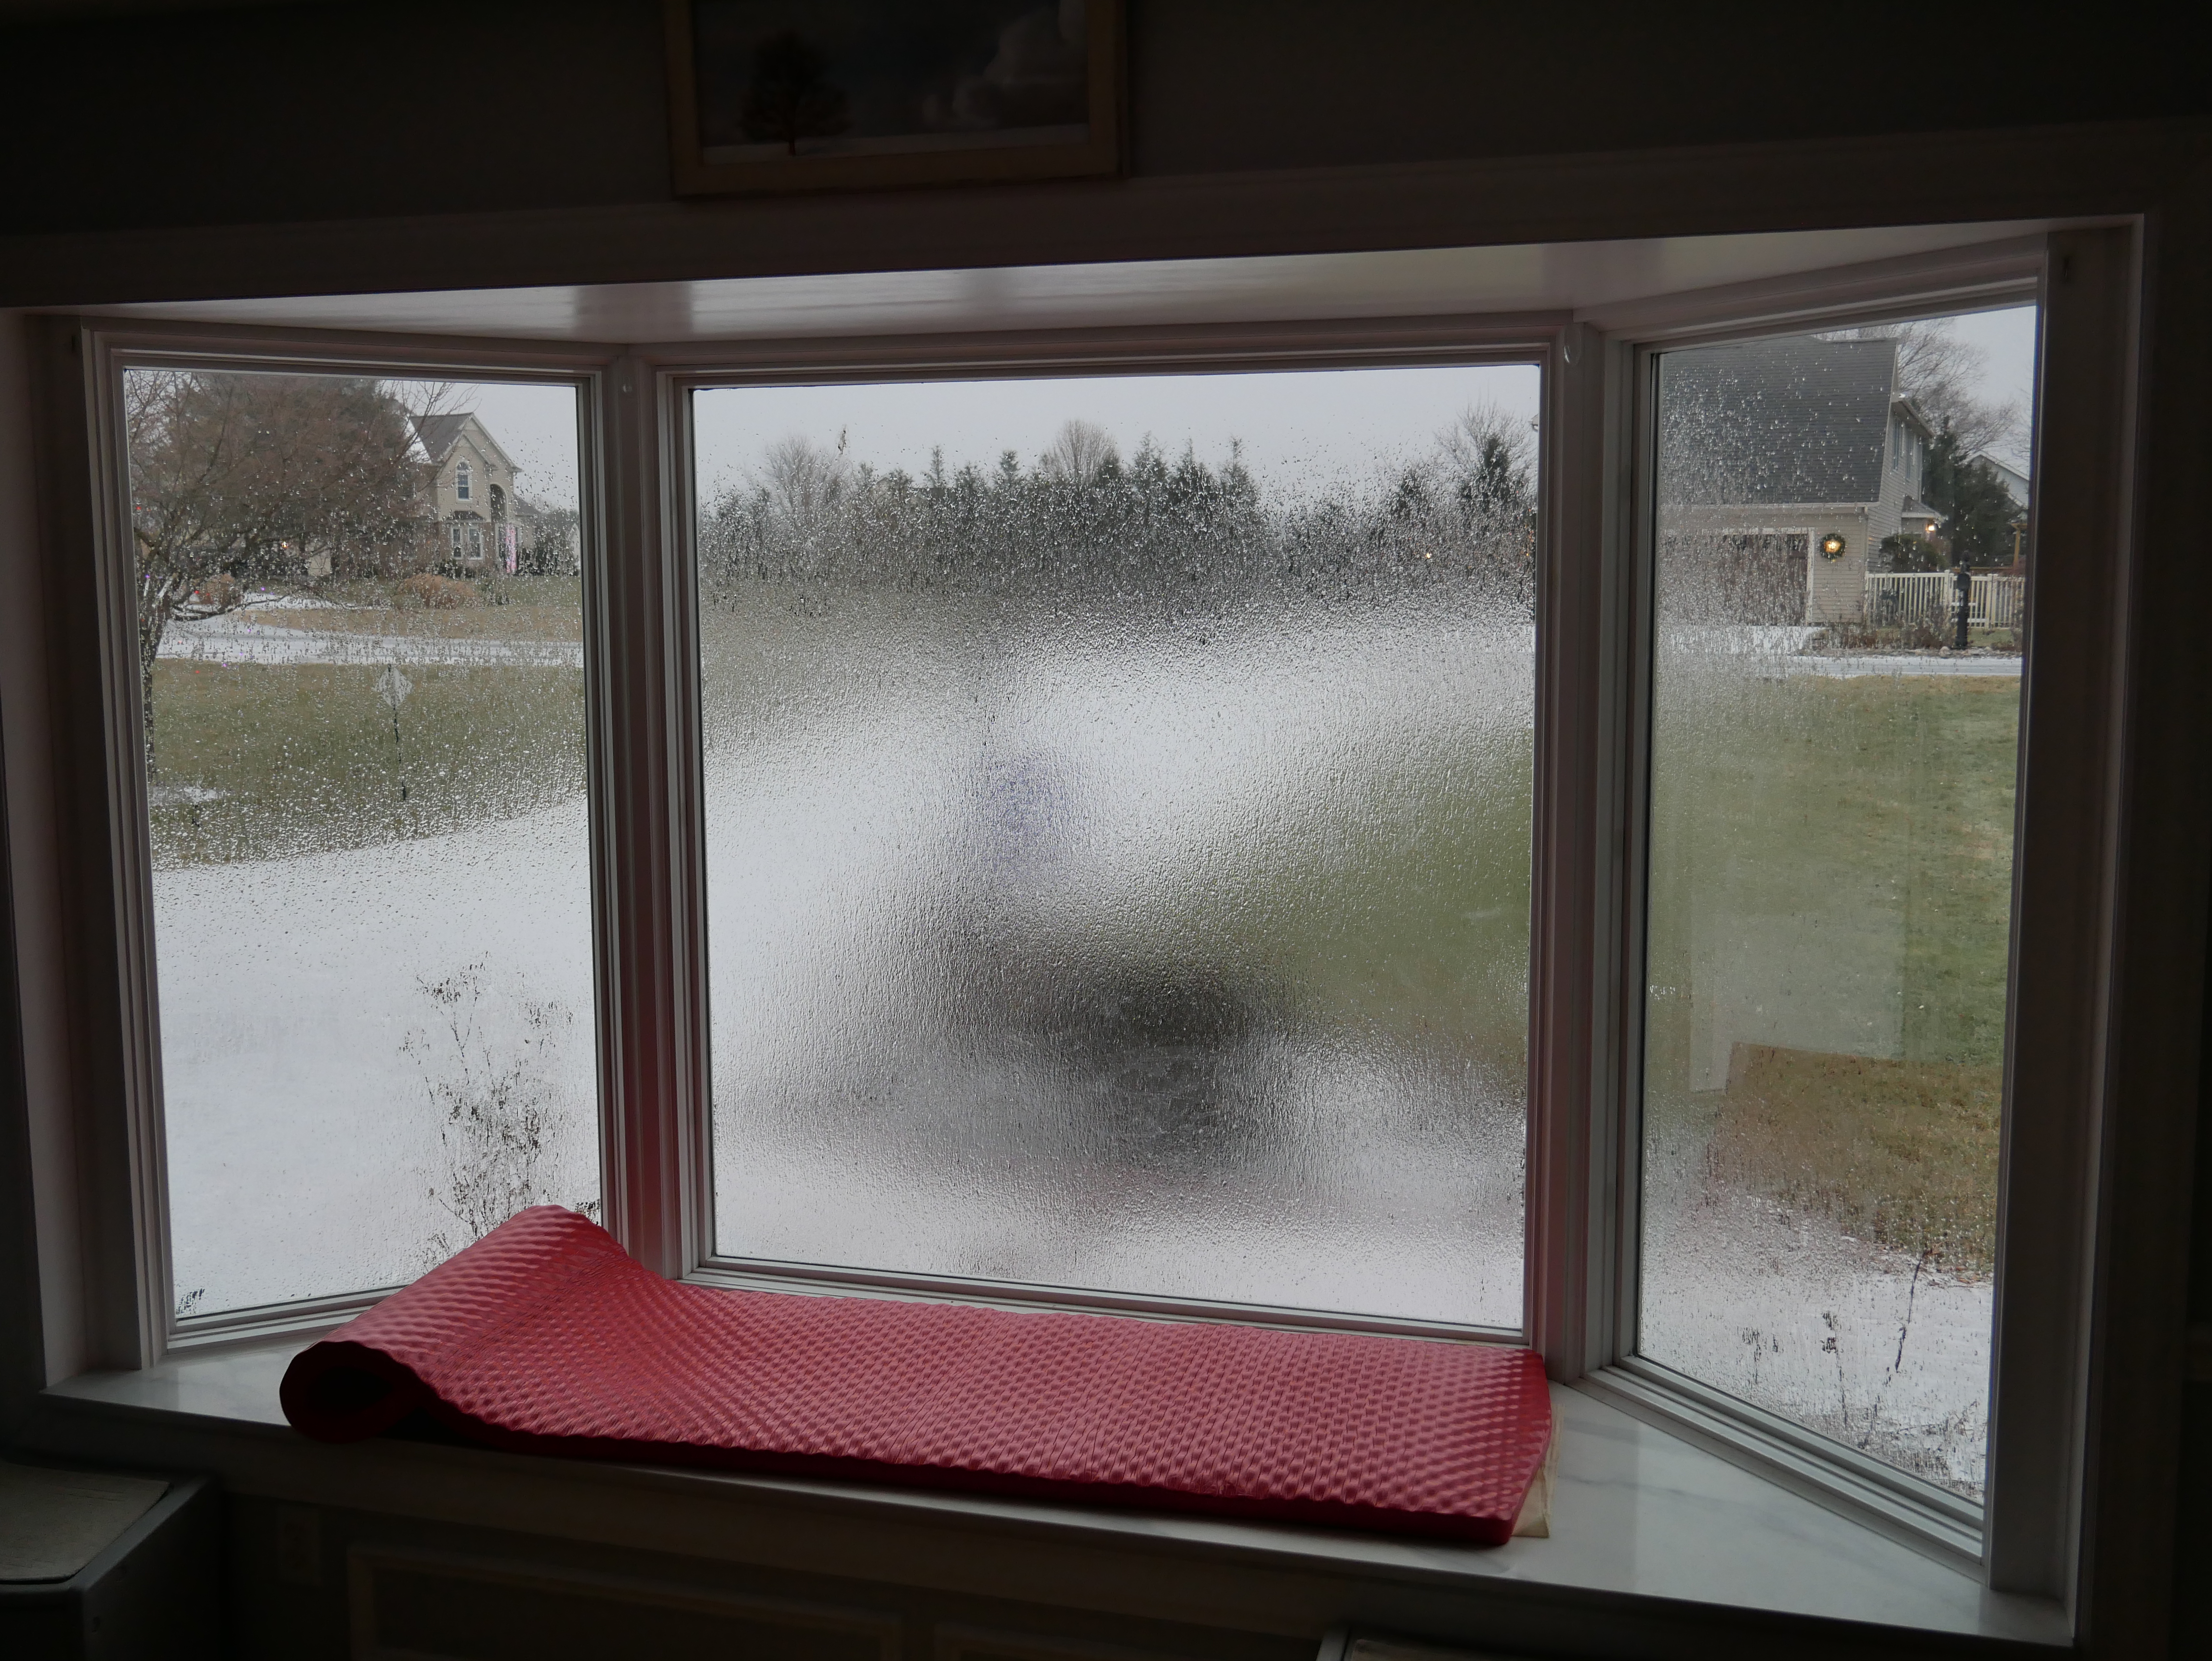
December temperatures were 3.8 F below normal, with a mean temperature of 28.4 F. The high for the month was 54.3 F deg. F, and the low was 1.1 F. Precipitation with 1.92 inches of liquid precipitation recorded, which was 1.26 inches below normal. There were 7.8 inches of snowfall.
The high wind speed was 51 mph.
2025 Stormstown Insolation