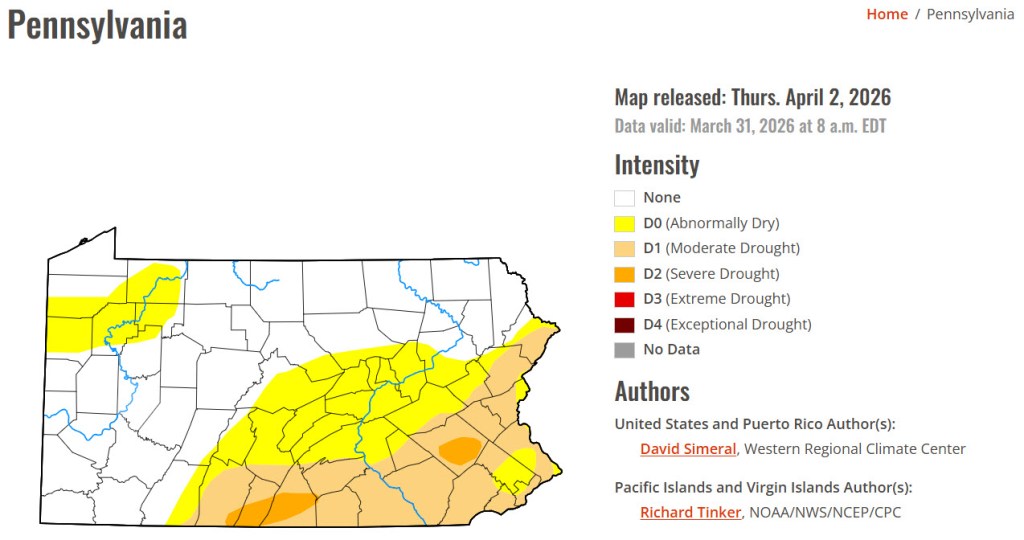
Above-normal rainfall in March has improved drought conditions across the region. If precipitation remains near normal, drought impacts should continue to diminish.
Above-normal rainfall in March has improved drought conditions across the region. If precipitation remains near normal, drought impacts should continue to diminish.
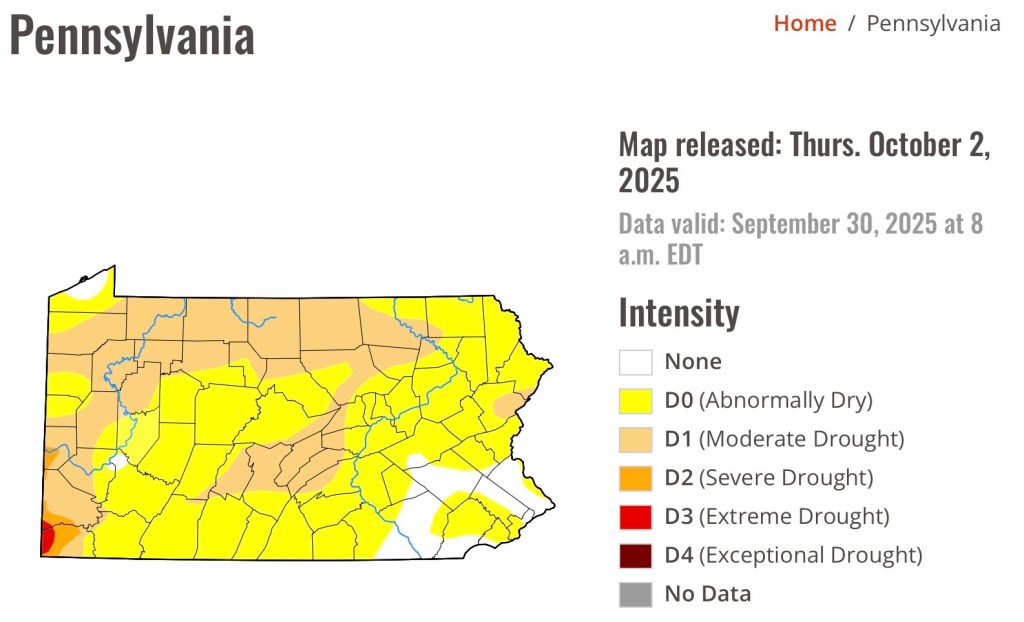
Dry conditions continue in The Commonwealth. A change in the weather pattern is forecast for next week.

June was 2.1 deg F above normal for temperature. The high for the month was 95 deg. F recorded on June 24. The low for the month was 36 deg F, recorded on June 2. There were 51 heating degree days and 206 cooling degree days.
June was an above normal month for precipitation with 5.81 inches of rainfall recorded, which was 1.72 inches above normal. The maximum rainfall in a single day was 1.43 inches recorded on June 14. There were 14 days of rain >.01 in, 10 >.10 in, and 1 > 1 in.
High wind speed of 35 mph on June 18.

June was 1.9 deg F above normal for temperature. The high for the month was 93.6 deg. F recorded on June 22. The low for the month was 43.9 deg F, recorded on June 1. There were 61 heating degree days and 210 cooling degree days.
June was a below normal month for precipitation with 2.45 inches of rainfall recorded, which was 1.64 inches below normal. The maximum rainfall in a single day was 0.97 inches recorded on June 29. There were 8 days of rain >.01 in, 5 >.10 in and 0 >1 in.
High wind speed of 27 mph on June 23.
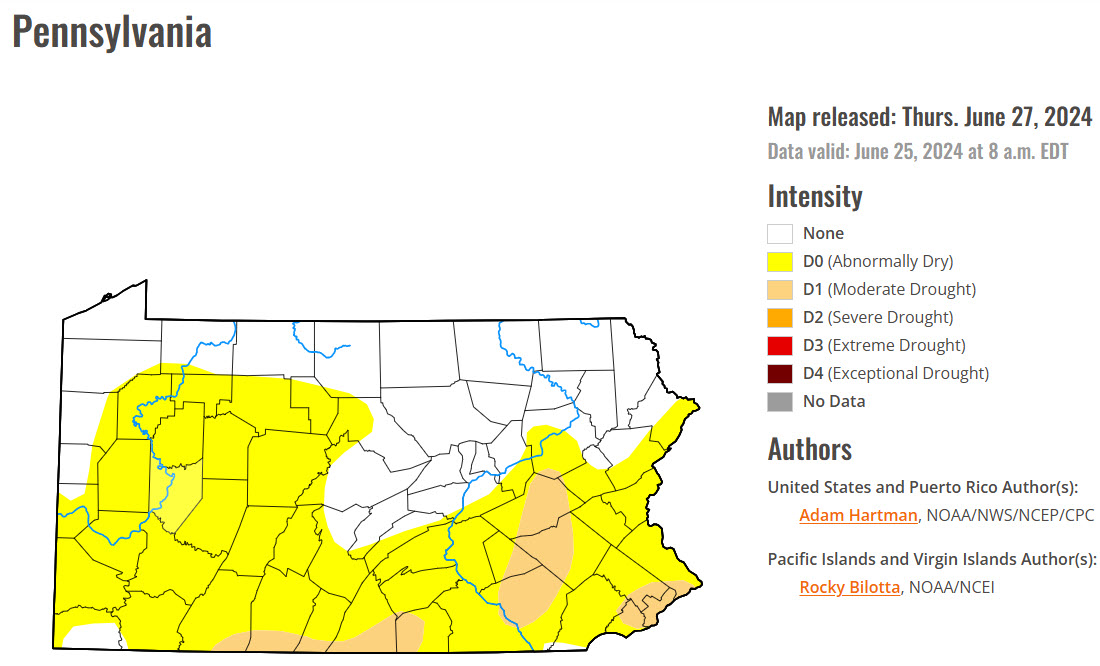
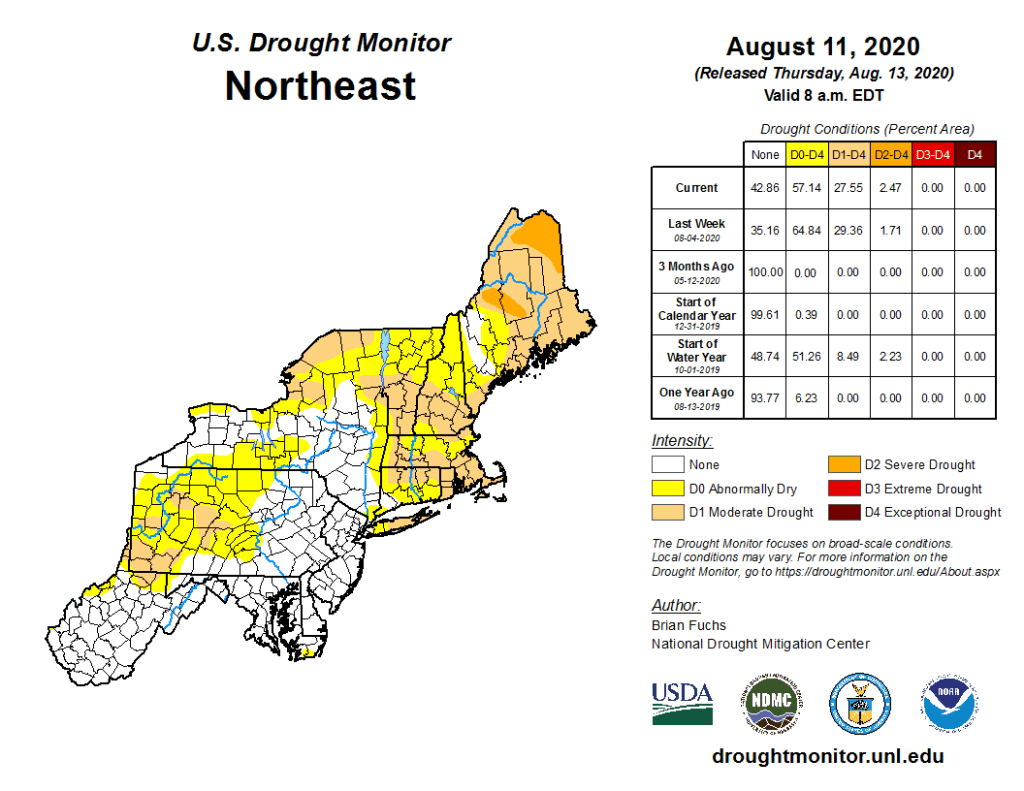
Here is the latest drought summary for Pennsylvania:
The following was recently posted by the State College National Weather Service Office. The chart was produced by The Mid-Atlantic River Forecast Center (MARFC) which is co-located with The State College National Weather Service Forecast Office.
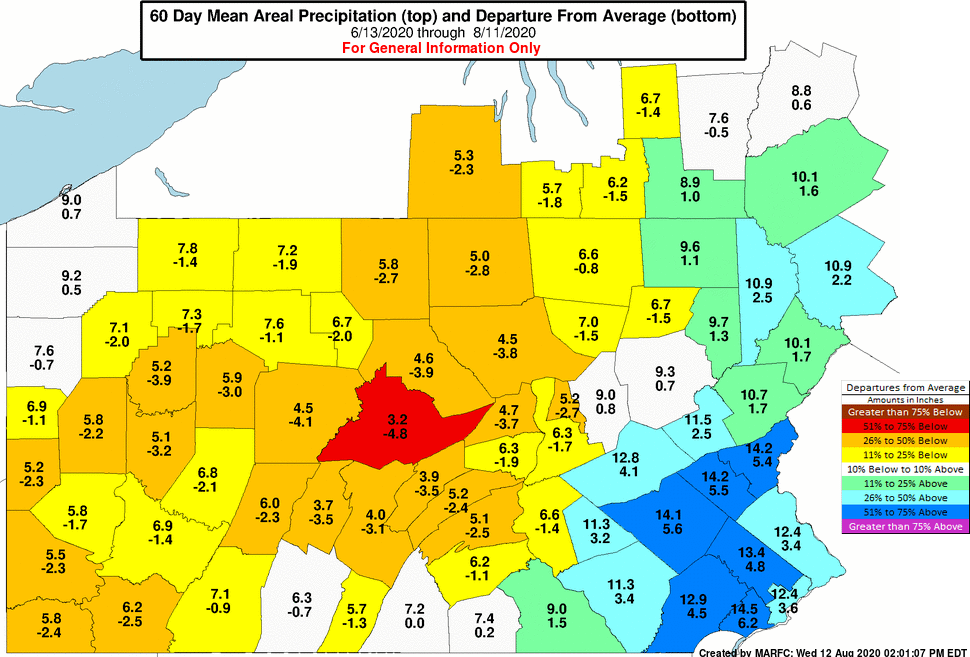
A neighbor asked to explain why Centre County was depicted as being a standout from the other counties.
For the 60-day period (6/13/2020 through 8/11/2020) Centre County’s areal precipitation was 3.2 inches which was 4.8 inches below normal for the period. A normal amount would have been 8 inches. This works out to be 60% below normal which is above the 50% threshold for the red portion of the scale. By comparison, here are the values for the surrounding counties: Blair 47%, Cambria 29%, Clearfield 47%, Clinton 41%, Huntington 43%, Mifflin 47%, Snyder 44%.
The River Forecast Centers use a distance weighting technique to calculate the areal precipitation. A grid of point estimates is made based on a distance weighting scheme. Each observed point value is given a unique weight for each grid point based on the distance from the grid point in question. The grid point precipitation value is calculated based on the sum of the individual station weight multiplied by observed station value. Once the grid points have all been estimated they are summed and the sum is divided by the number of grid points to obtain the areal average precipitation.
Here is a map of standardized precipitation index (SPI).
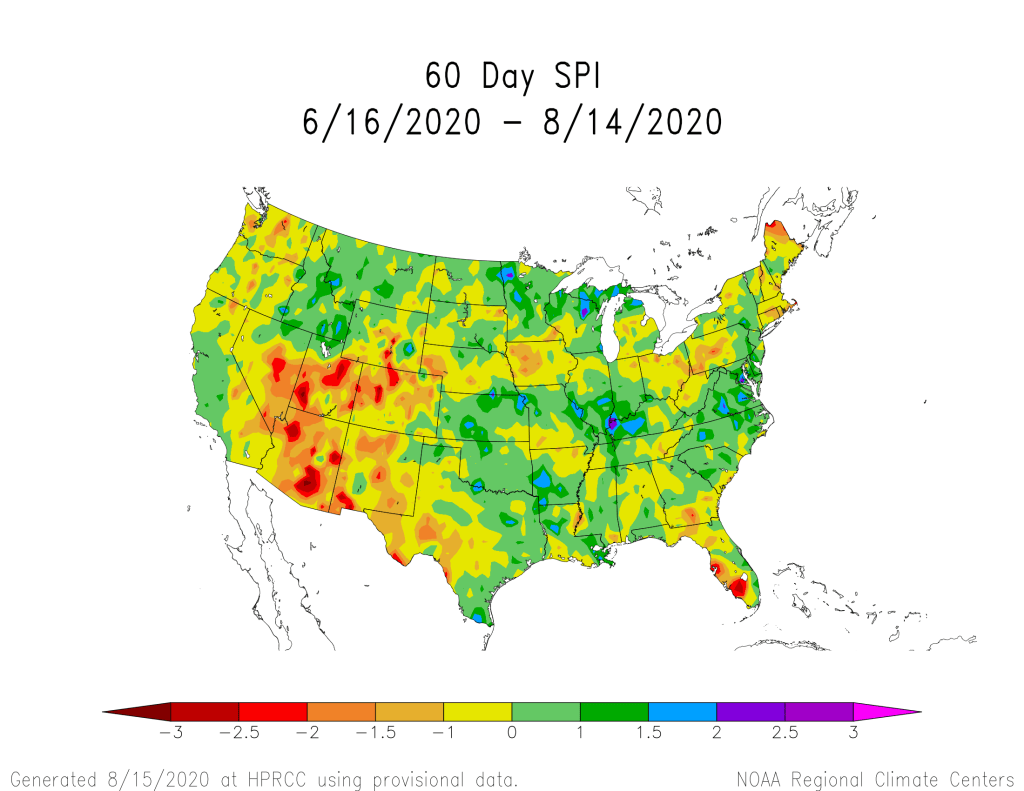
There is a bullseye of values between -2 and -1.5 over our region.
The SPI is a widely used index to characterize meteorological drought on a range of timescales. On short timescales, the SPI is closely related to soil moisture, while at longer timescales, the SPI can be related to groundwater and reservoir storage. The SPI uses precipitation only, and can characterize drought or abnormal wetness at different time scales which correspond with the time availability of different water resources (e.g. soil moisture, snowpack, groundwater, river discharge and reservoir storage).
As the above map indicates, southwestern Centre County is experiencing a moderate drought. The criteria for drought classification appears below.

July was lower than normal for precipitation for six counties in central Pennsylvania.

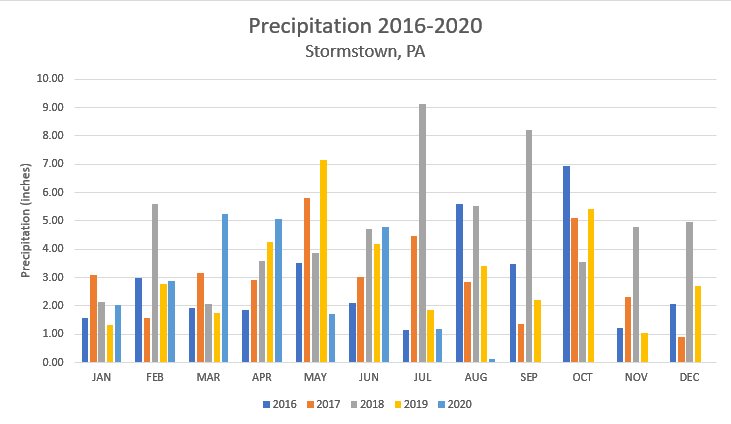
The above graph shows all of the precipitation data I have collected since establishing my weather station in December 2015 until now. This past July was as dry as July 2016. However, August 2020 is on track to be the driest in 5 years.
