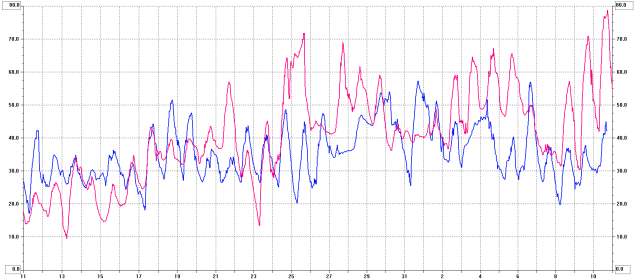
The following is a graph comparing 2017 temperatures (the red line) with 2018 temperatures (the blue line). Temperatures are in deg F from March 11 to April 10. This shows how much colder than last year this spring has been so far.
The following is a graph comparing 2017 temperatures (the red line) with 2018 temperatures (the blue line). Temperatures are in deg F from March 11 to April 10. This shows how much colder than last year this spring has been so far.
