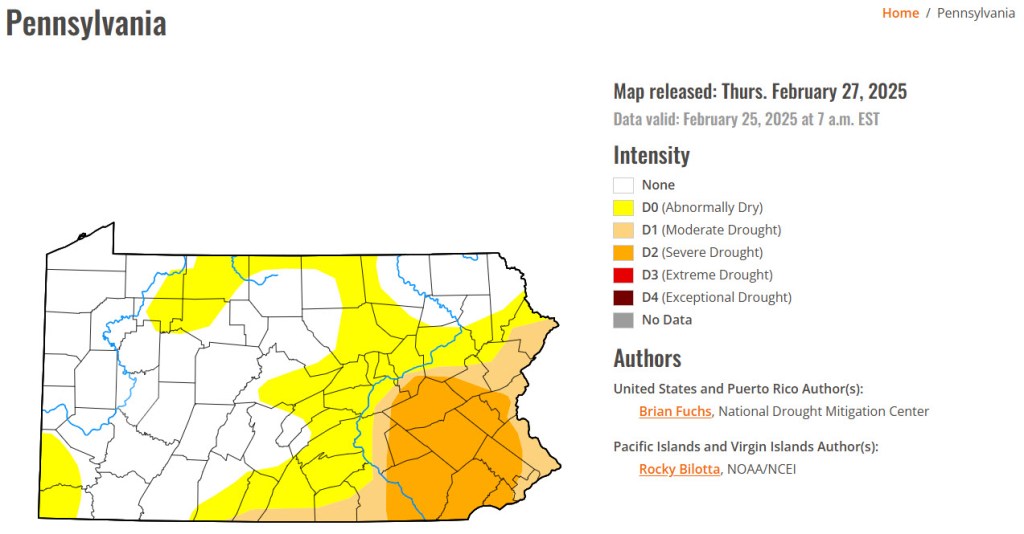
Meteorological Autumn is officially over. Here is a brief summary of September 1-November 30 in Stormstown, PA:
Number of days Max T >= 90 F: 0
Number of Days Max T <= 32 F: 0
Number of Days Min T <= 32 F: 21
The first freeze of the season occurred on October 10.
Max T: 88.5 F – September 19, 2025
Min T: 23.4 F – November 18, 2025
Sep Dep from Normal: 0.7 F
Oct Dep from Normal: -0.3 F
Nov Dep from Normal: -0.6 F
Heating Degree Days: 1305
Cooling Degree Days: 124
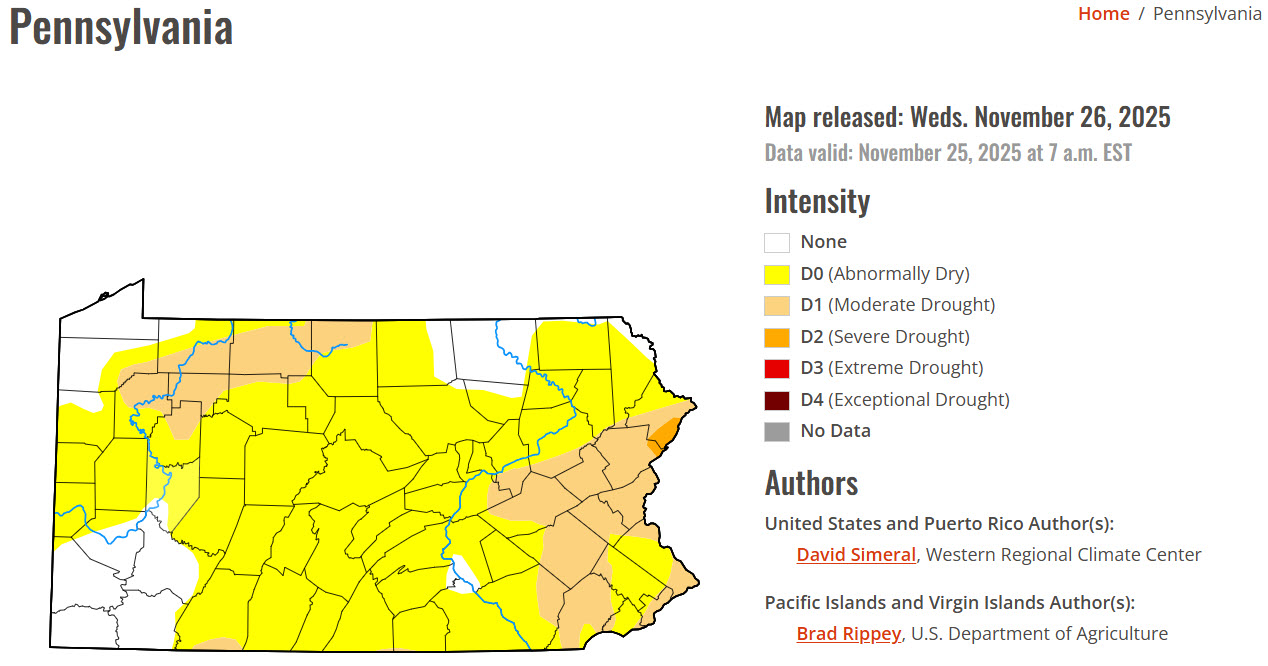
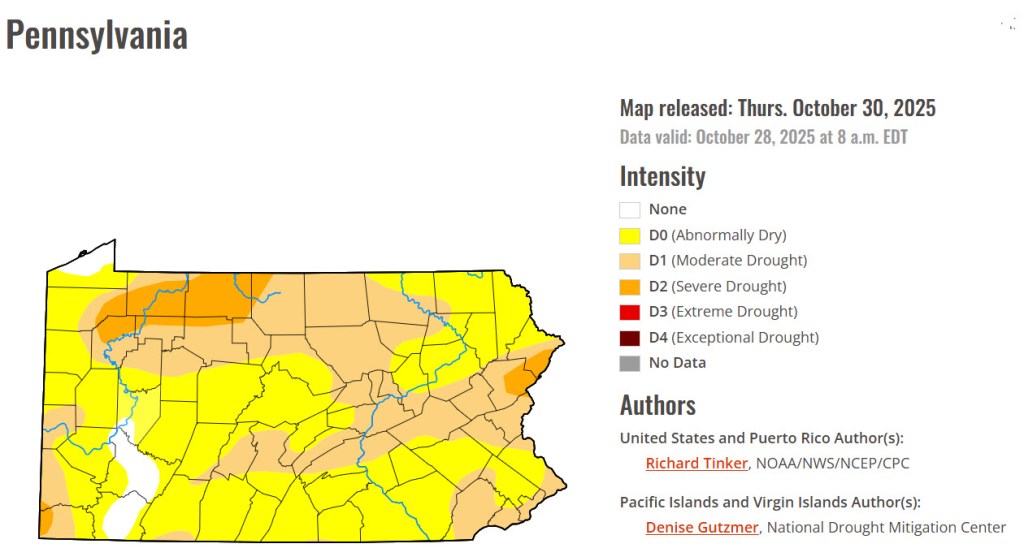
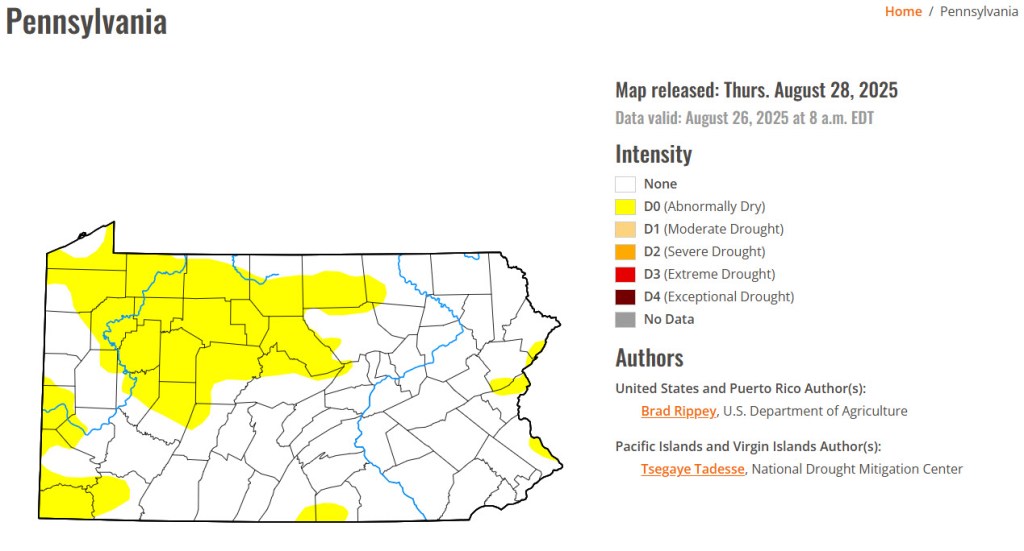
Sep Precip: 3.46″, 0.49″ below normal
Oct Precip: 3.26″, 0.20″ below normal
Nov Precip: 2.24″, 0.75″ below normal
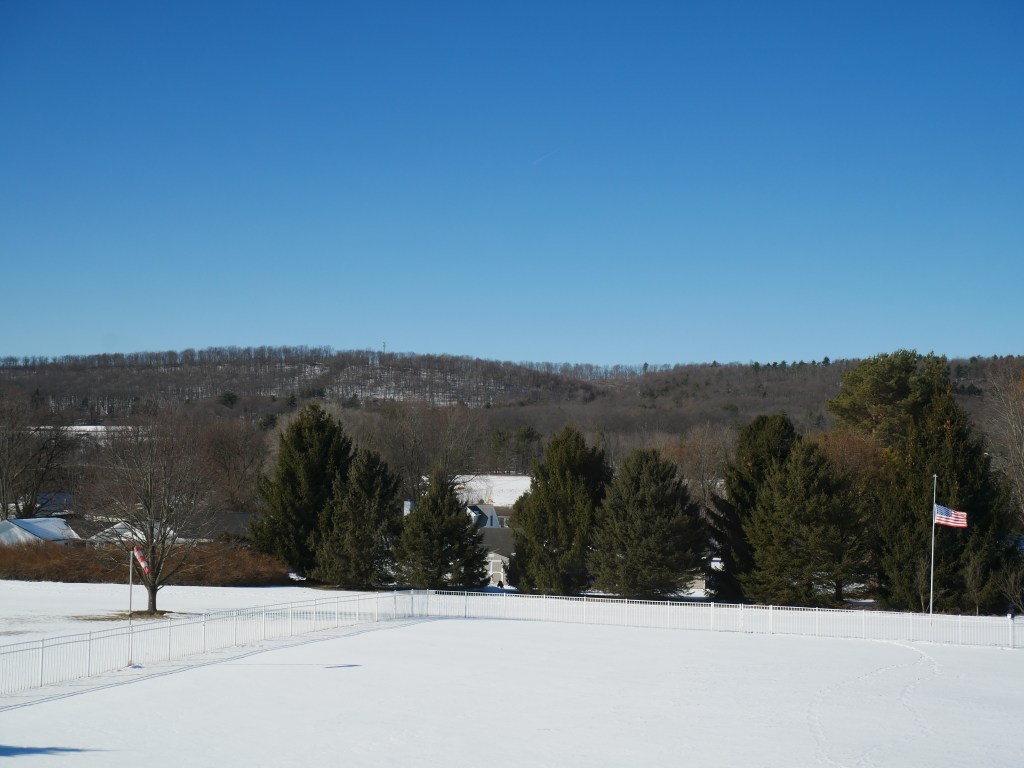
The first snowfall of the season occurred on November 11.