August was 3.1 deg F below normal for temperature. The high for the month was 90.8 deg. F recorded on August 12. The low for the month was 39.4 deg F, recorded on August 30. There was 1 day at or above 90 deg F. There were 93 heating degree days and 165 cooling degree days.
August was a below-normal month for precipitation with 1.84 inches of rainfall recorded, which was 2.32 inches below normal. The maximum rainfall in a single day was 0.78 inches, recorded on August 20. There were 7 days of rain >.01 in, 3 >.10 in, and 0 >1 in.
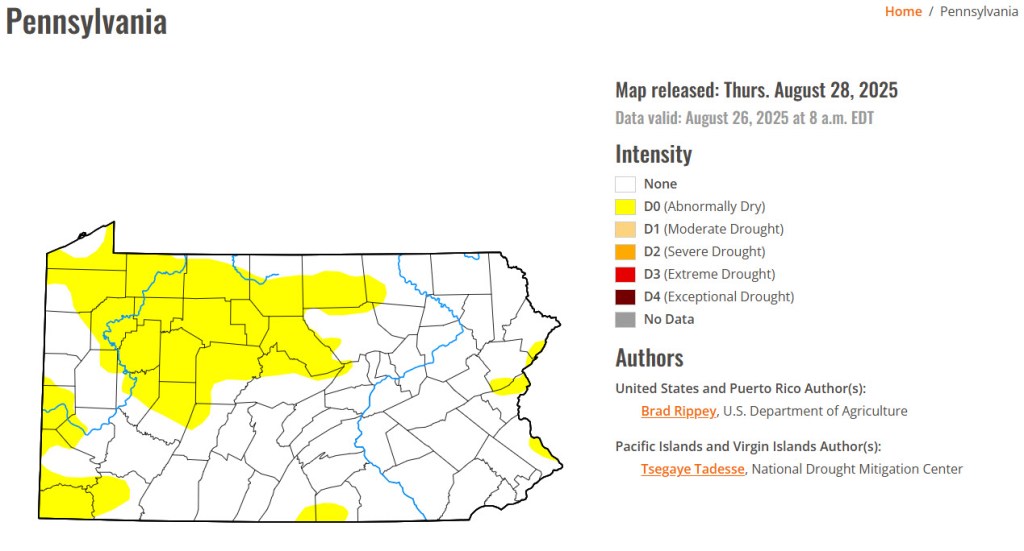
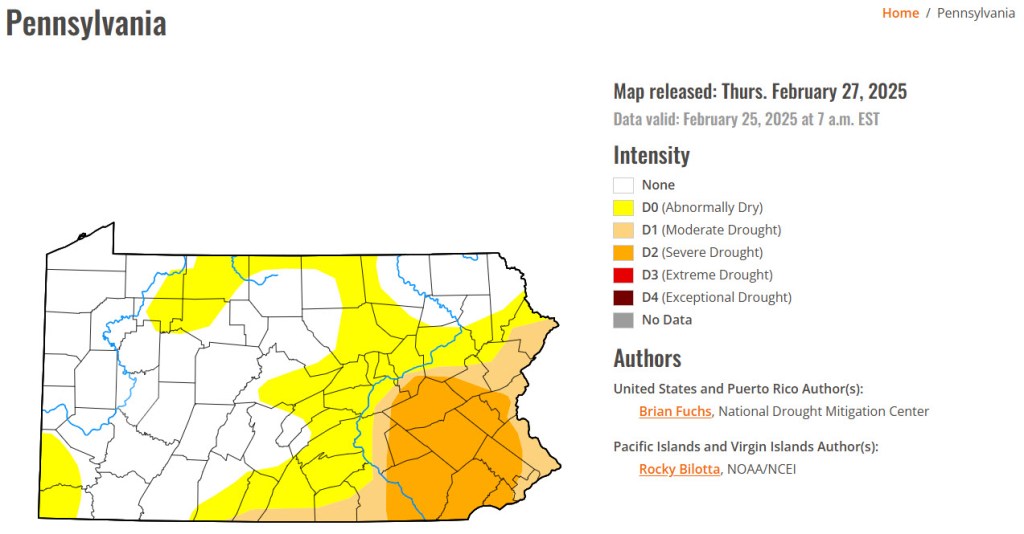
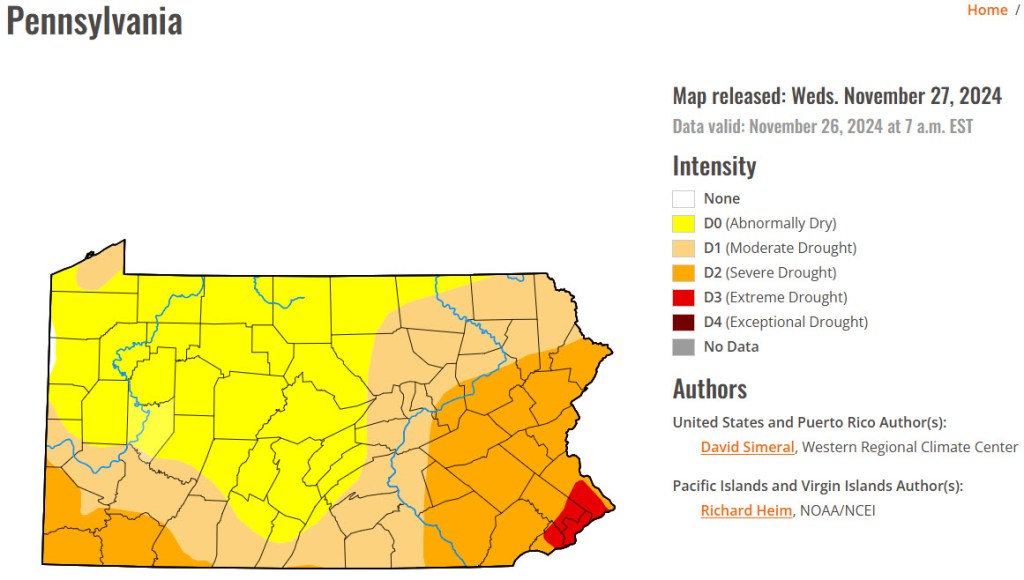
There are areas of abnormally dry conditions in The Commonwealth:
July was 2.3 F above normal for temperature. The high for the month was 93.7 deg. F recorded on July 30. The low for the month was 52.2 deg F, recorded on July 22. There were 6 days at or above 90 deg F. There were 15 heating degree days and 311 cooling degree days.
July was an above-normal month for precipitation, with 5.30 inches of rainfall recorded, which was 1.51 inches above normal. The maximum rainfall in a single day was 1.79 inches recorded on July 26. There were 9 days of rain >.01 in, 9 >.10 in, and 1 >1 in.
February was 0.3 deg F above normal for temperature. The high for the month was 53.8 deg. F, recorded on February 4. The low for the month was 7.9 deg F, recorded on February 19. There were 10 days when the maximum was at or below 32 F and 24 days when the minimum temperature was at or below 32 F. There were 998 heating degree days and 0 cooling degree days.
February was an above-normal month for precipitation with 1.74 inches of rainfall recorded, which was 0.42 inches above normal. The maximum rainfall in a single day was 0.81 inches recorded on February 16. There were 12 days of rain >.01 in, 7 >.10 in, and 0 > 1 in.
There were 5.4 inches of snow for the month, with a maximum daily total of 1.6 inches on February 16.
January was 3.5 deg F below normal for temperature. The high for the month was 44.8 deg. F, recorded on January 31. The low for the month was -8.7 deg F, recorded on January 22. There were 17 days when the maximum was at or below 32 F, 31 days when the minimum temperature was at or below 32 F, and 3 days when the minimum temperature was at or below 0 F. There were 1274 heating degree days and 0 cooling degree days.
January was a below-normal month for precipitation with 1.46 inches of liquid precipitation recorded, which was 1.46 inches below normal. The maximum liquid precipitation in a single day was 0.47 inches recorded on January 31. There were 11 days of rain >.01 in, 4 >.10 in, and 0 > 1 in.
There were 9.3 inches of snow for the month, with a maximum daily total of 2.4 inches on January 4.
Overall, the year’s temperatures were above normal. The annual mean of 52.8 F was 2.6 F above normal. The annual precipitation of 43.74 inches was 2.21 inches above normal.
2024 Weather Data
January
January was the coldest month of 2024 but was warmer than normal with a monthly mean of 31.3 F, which was 4.1 F above normal, with a high of 62.6 F and a low for the month of 4.8 F. Precipitation was 1.93 inches above normal with 4.85 inches of liquid precipitation. There were 8.3 inches of snow for the month, with a maximum daily total of 5.5 inches on January 7.
High wind speed for the month and year was 47 mph on January 14.
February
February was an above-normal month for temperature, with a mean of 36.1 F, which was 7.0 F above normal. The high was 61.4 F and the low was 4.8 F. Precipitation was 0.72 inches below normal at 1.74 inches. There were 6.3 inches of snow for the month, with a maximum daily total of 4.0 inches on February 17.
High wind speed of 39 mph on February 28.
March
March temperatures were 7 F above normal with a mean of 44 F. The high was 74.2 F and the low was 18.5 F. Precipitation was 0.02 inches below normal with 3.36 inches of liquid precipitation. There was no measurable snow accumulation.
High wind speed of 45 mph on March 11.
April
Temperatures were 2.9 F above normal in April with a mean temperature of 63.0 F. The high was 84 F and the low was 28.0 F. Rainfall was 2.41 inches above normal at 5.92 inches. The last day of temperatures below freezing was April 22.
The high wind speed for the month was 38 mph.
May
Temperatures were 2.6 F above normal with a mean temperature of 62.4 F. The high was 85.4 F and the low of 40.1 F. Precipitation was 5.40 inches, 1.76 inches above normal.
The high wind speed was 34 mph.
June
Temperatures for the month were 1.9 F above normal with a mean of 70 F. The high for the month was 93.6 F and the low was 43.9 F. Precipitation was 1.64 inches below normal with 2.45 inches of rainfall.
The high wind speed was 27 mph.
July
July was the warmest month and temperatures were 1.9 F above normal with a mean of 74 F. The high for the month was 94.7 F and the low was 49.5 F. Rainfall was 1.49 inches below normal with 2.30 inches of precipitation.
The high wind speed was 29 mph.
August
August temperatures were 0.7 F below normal with a mean of 69.7 F. The high was 92.9 F and the low was 45.4 F. Precipitation was 5.20 inches above normal at 9.36 inches. August was the rainiest month of 2024.
The high wind speed was 28 mph.
September
Temperatures were normal with a mean of 63.5 F. The high was 83.9 F and the low was 42.4 F. There were 1.94 inches of rainfall, which was 2.01 inches below normal.
High wind speed was 25 mph.
October
October was mild with temperatures at 1.4 F above normal with a mean of 53.3 F. The high was 80.4 F and the low was 29.7 F. The first freeze was on October 15. Rainfall was 0.95 inches, which was 2.51 inches below normal.
The high wind speed was 25 mph.
November
Temperatures in November were mild at 3.1 F above normal with a mean of 44.3 F. The high was 72.2 F and the low was 20.9 F. Precipitation was 2.55 inches, 0.44 inches below normal. The first snowfall of the season was on November 22.
The high wind speed was 30 mph.
December
December temperatures were near normal, with a mean temperature of 32.2 F. The high for the month was 61.8 F deg. F, and the low was 4.1 F. Precipitation with 2.92 inches of liquid precipitation recorded, which was 0.26 inches below normal. There were 2 inches of snowfall.
December was near normal for temperature. The high for the month was 61.8 deg. F, recorded on December 29. The low for the month was 4.1 deg F, recorded on December 23. There were 26 days when the minimum temperature was at or below 32 F, 9 days when the maximum temperature was at or below 32 F, and 0 days when the minimum temperature was below 0. There were 1017 heating degree days and 0 cooling degree days.
December was a below-normal month for precipitation with 2.92 inches of liquid precipitation recorded, which was 0.26 inches below normal. The maximum rainfall in a single day was 0.72 inches recorded on December 9. There were 13 days of rain >.01 in, 7 >.10 in and 0 > 1 in.
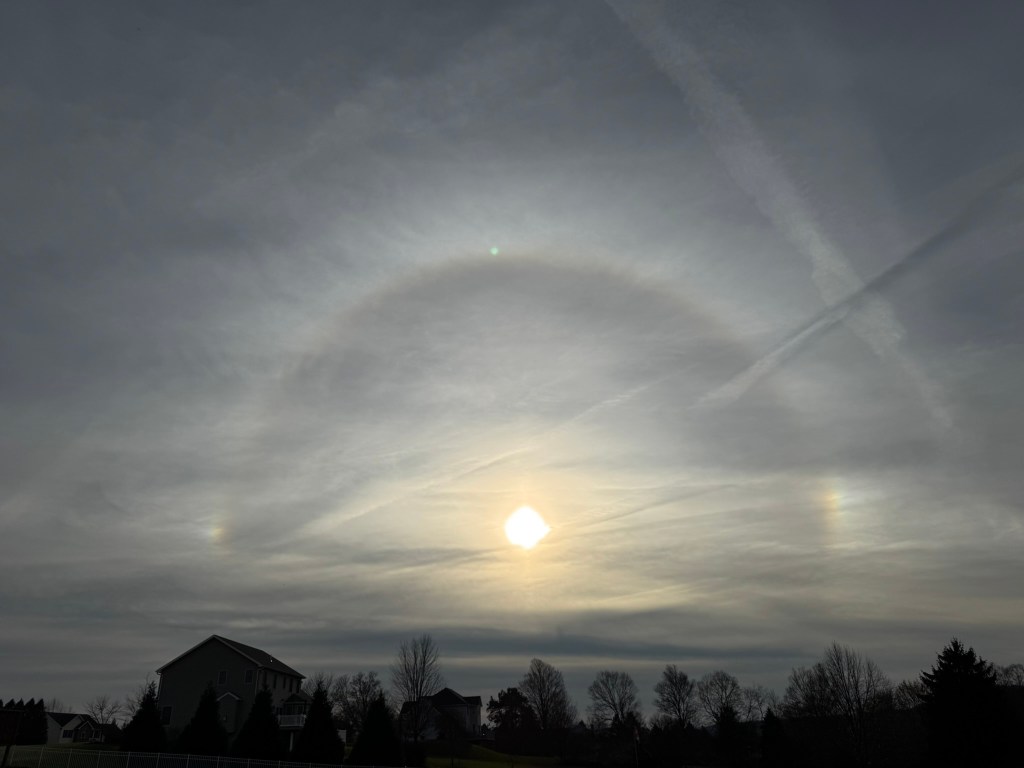
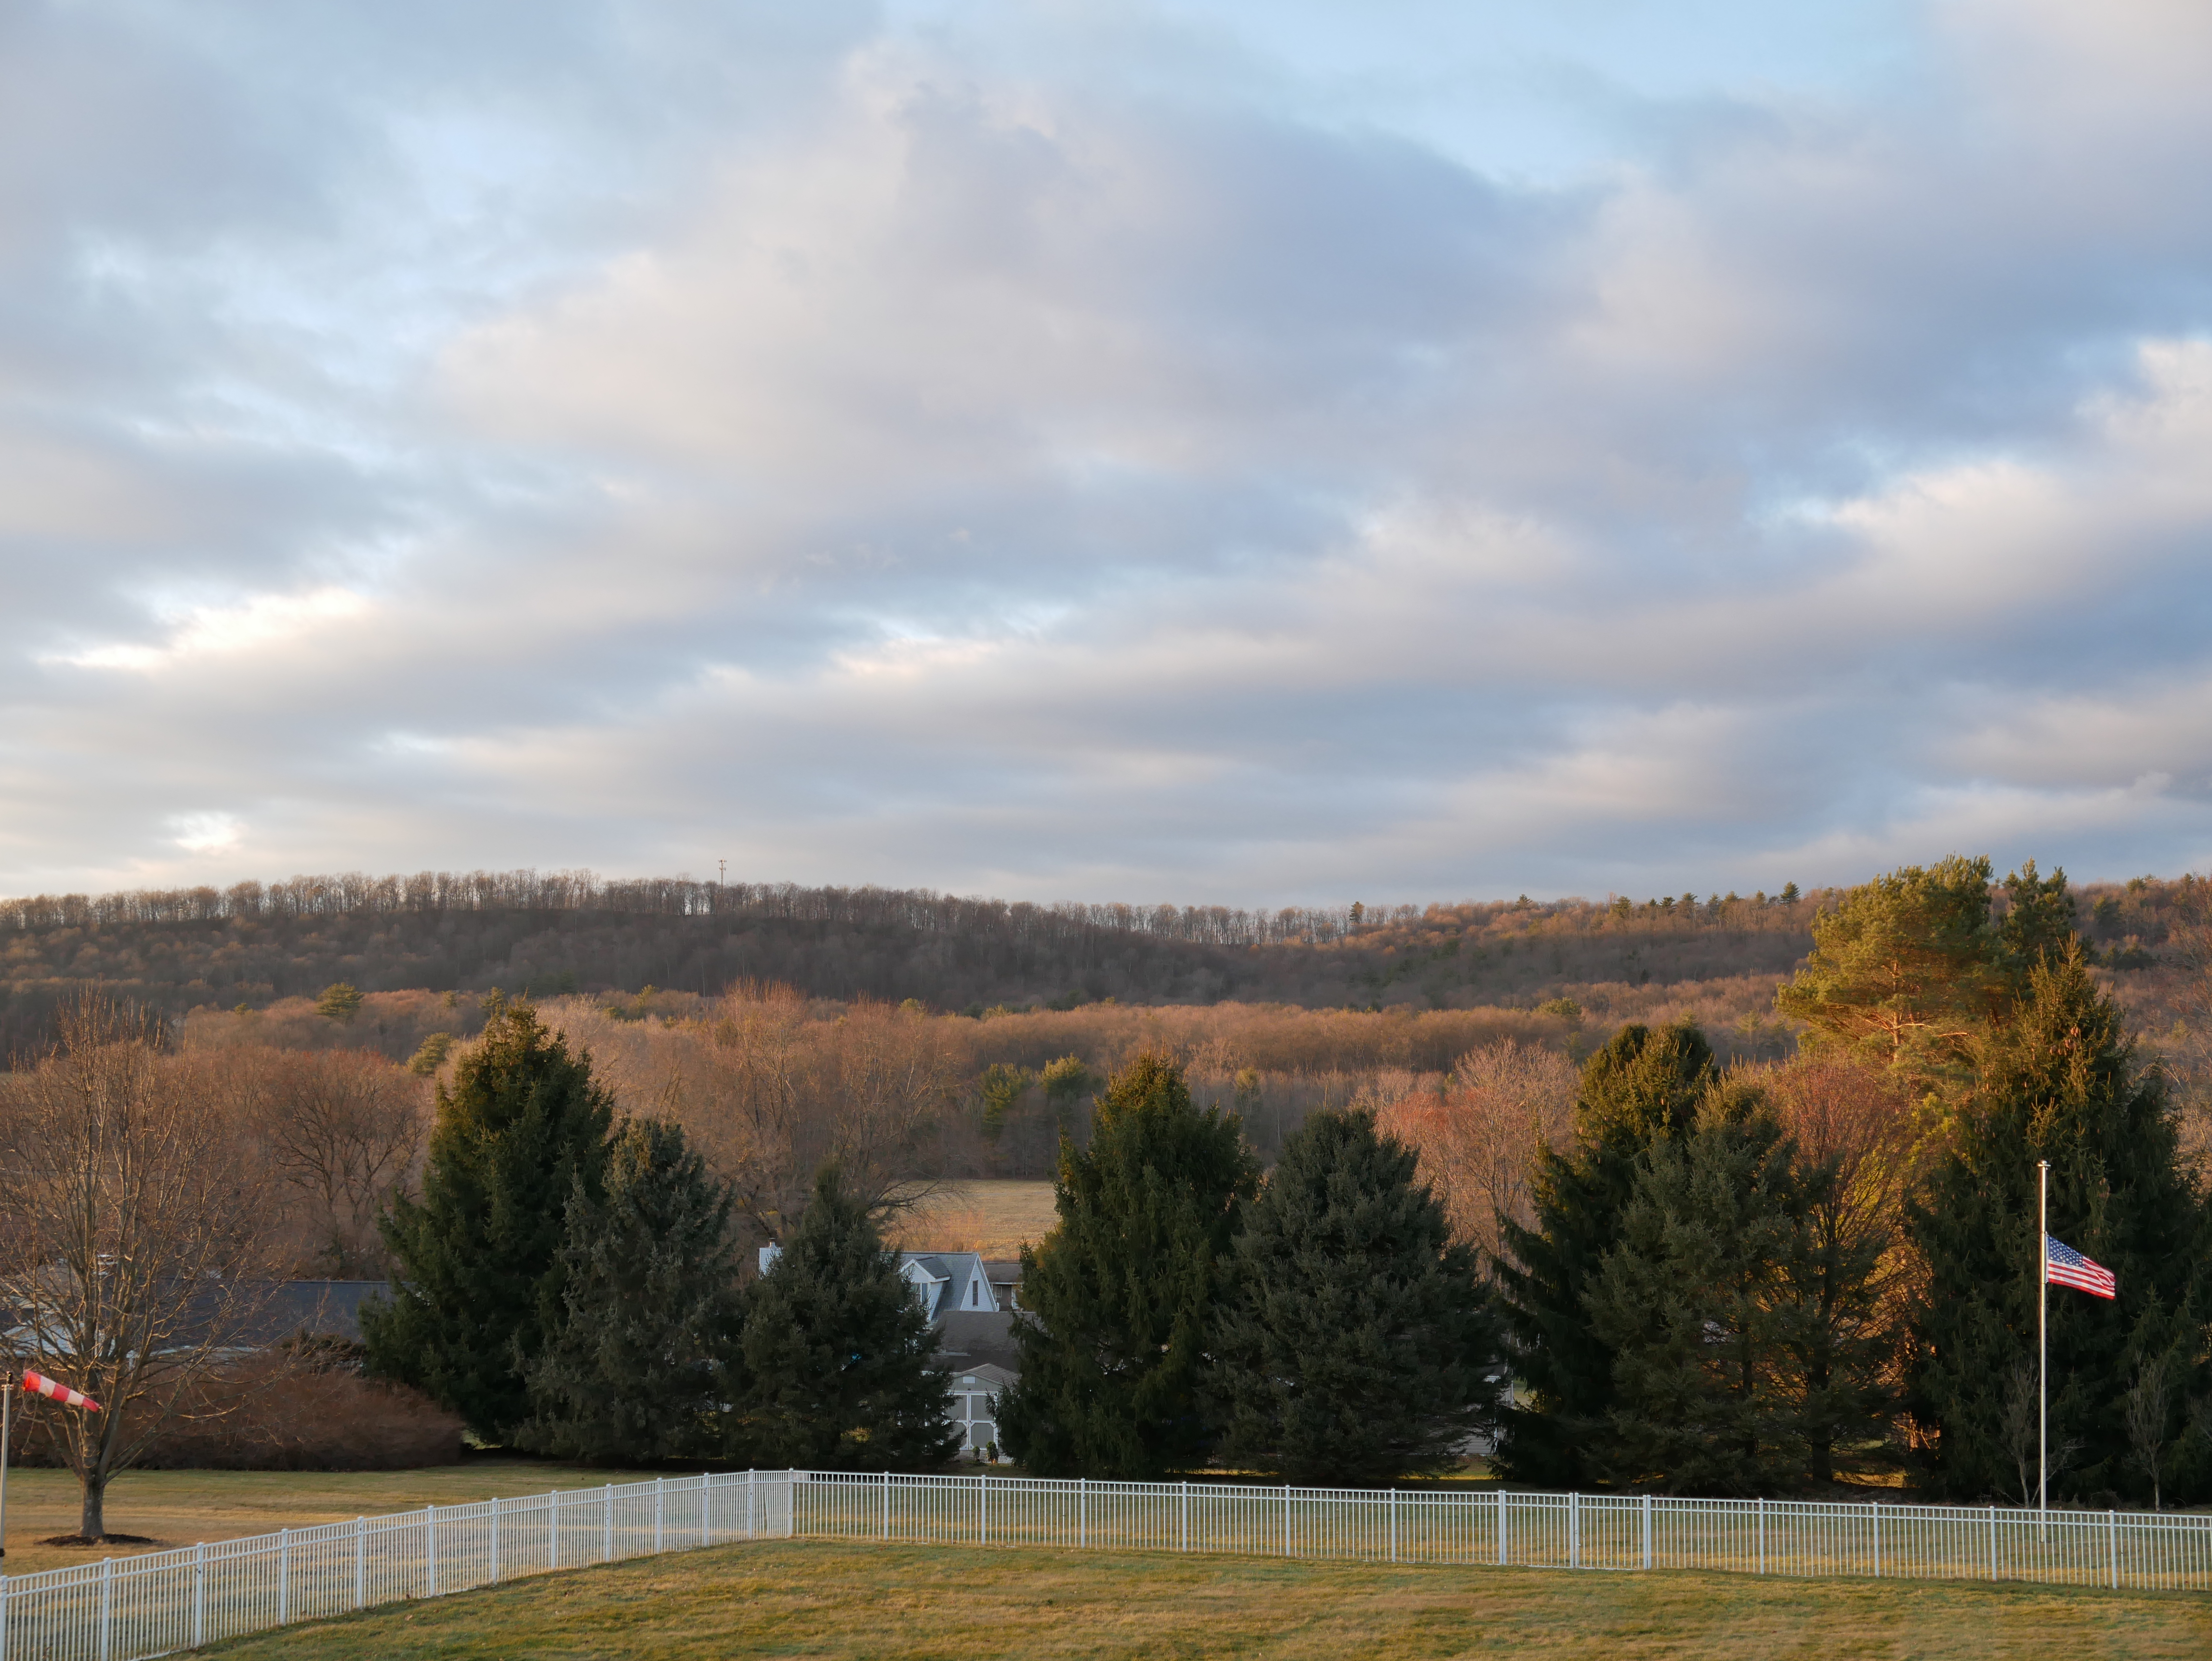
November was 3.1 deg F above normal for temperature. The high for the month was 72.2 deg. F, recorded on November 6. The low for the month was 20.9 deg F, recorded on November 30. There were 10 days at or below 32 F and 1 day when the maximum temperature was at or below 32 F. There were 730 heating degree days and 0 cooling degree days.
November was a below-normal month for precipitation with 2.55 inches of rainfall recorded, 0.44 inches below normal. The maximum rainfall in a single day was 0.68 inches recorded on November 10. There were 11 days of rain >.01 in, 6 >.10 in, and 0 > 1 in.
The first snowfall of the season was on November 22.