April was 2.4 F above normal for temperature. The high for the month was 85.0 F, recorded on April 29. The low for the month was 19.4 F, recorded on April 9. There were 5 days at or below 32 F. There were 434 heating degree days and 37 cooling degree days.
April was an above-normal month for precipitation with 4.08 inches of rainfall recorded, which was 0.57 inches above normal. The maximum rainfall in a single day was 0.84 inches recorded on April 5. There were 15 days of rain >.01 in, 10 >.10 in, and 0 > 1 in.
There was a trace of snow in April.
High wind speed of 49 mph on April 29.
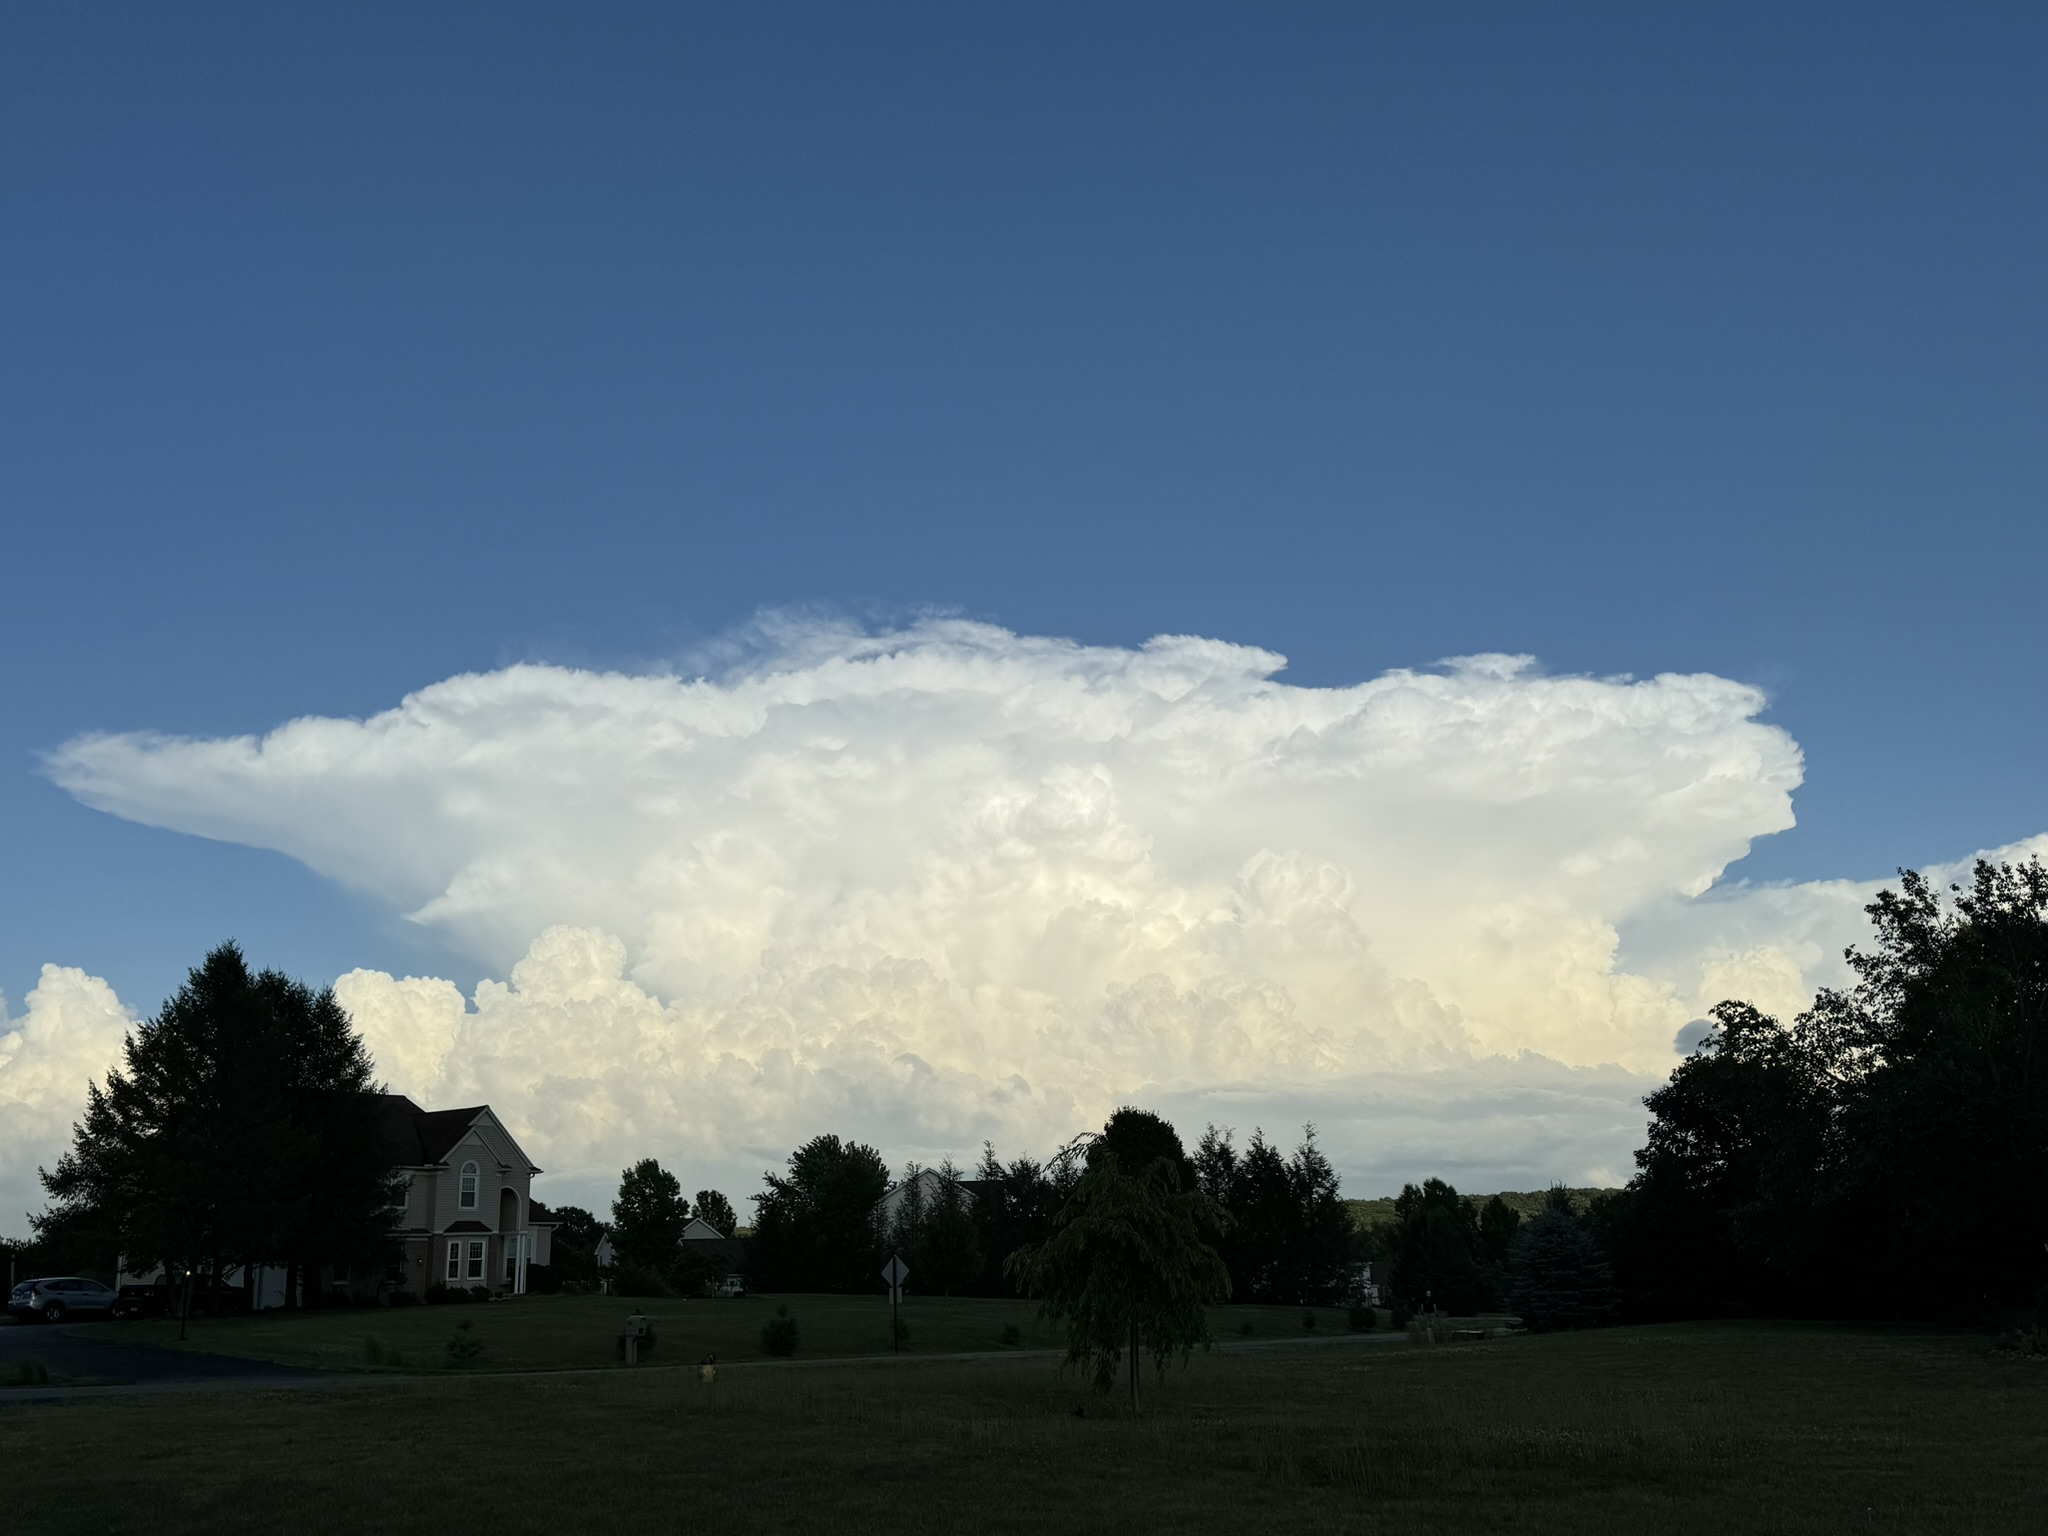
A severe thunderstorm occurred on April 29, critically damaging trees, utility poles, and power lines. Power was out from April 29 at 6:43 PM until May 3 at 2:21 AM. No data was lost for April, but a few hours on May 2-3 were lost due to battery failure of the data logger.
The State College National Weather Service Office has classified the storm as a quasi-linear convective system (QLCS) due to its long and wide path.