Overall, the year’s temperatures were slightly above normal. The annual mean of 50.5 F was 0.2 F above normal. The annual precipitation of 39.66 inches was 1.87 inches below normal.
2022 Weather Data
January

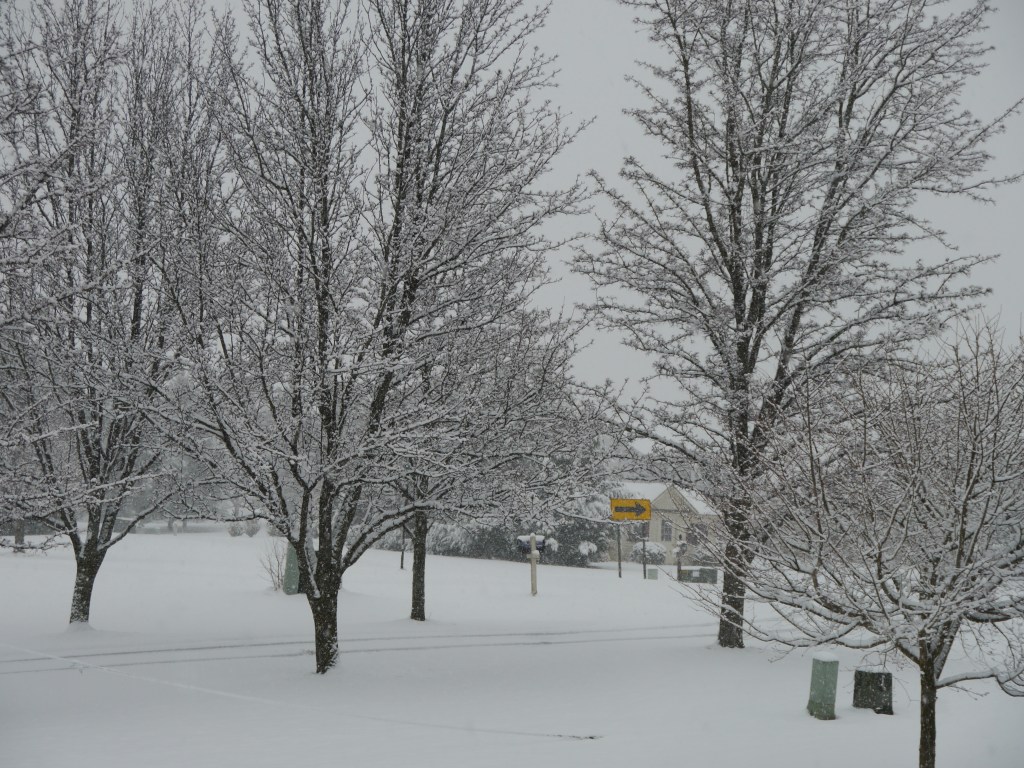
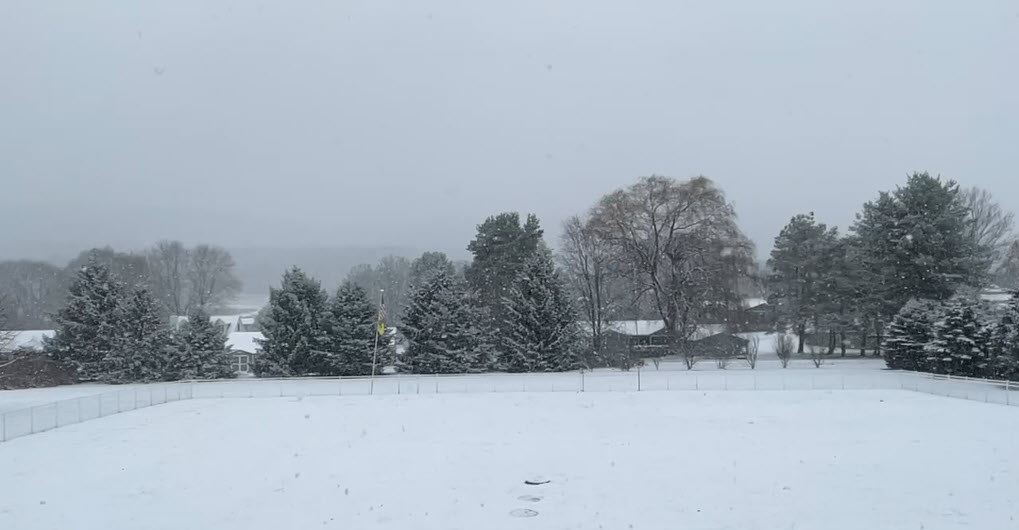
January was the coldest month of 2022 and was colder than normal with a monthly mean of 24.3 F, which was -2.9 F below normal, with a high of 53.8 F and a low for the month of -6.2 F, which was also the low for the year.. Precipitation was 1.63 inches below normal with 1.29 inches of liquid precipitation. There were 13.8 inches of snow this month.
February

February was an above-normal month for temperature, with a mean of 30.8 F, which was 1.7 F above normal. The high was 11.8 F and the low was 5.7 F. Precipitation was 1.88 inches above normal at 4.34 inches. There were 3.4 inches of snow for the month, with a maximum daily total of 1.7 inches on February 25.
March
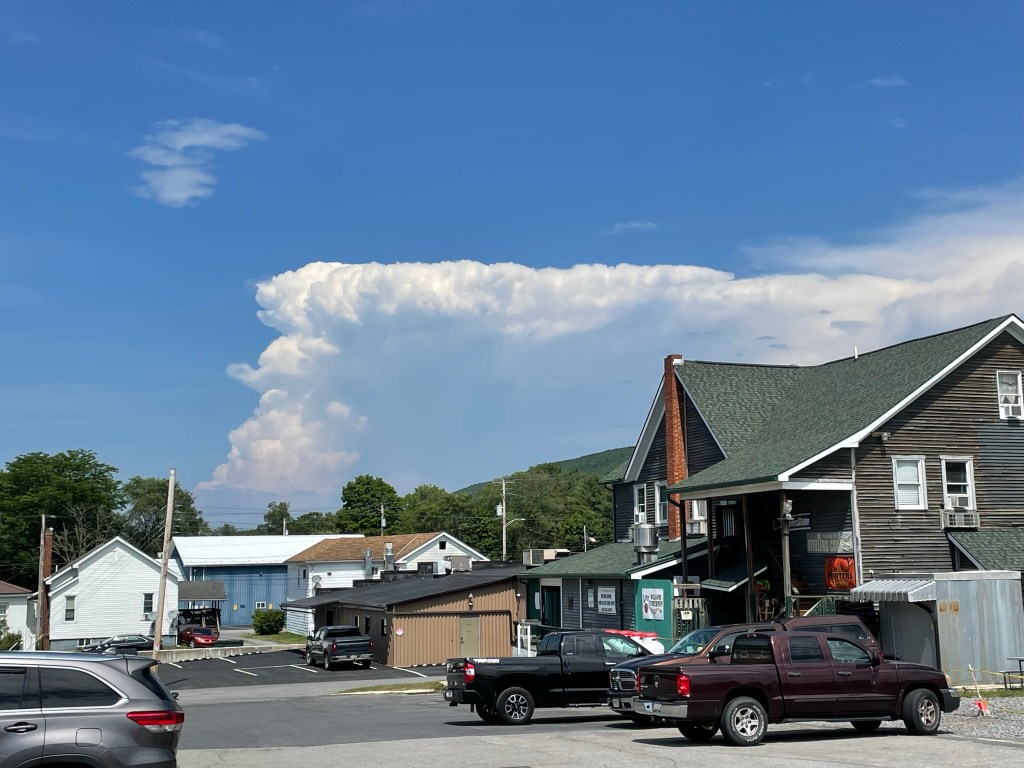
March temperatures were also mild at 4.1 F above normal with a high of 71.5 F and a low of 12.5 F. Precipitation was 0.13 inches below normal with 3.25 inches of liquid precipitation. The high wind speed for the month and year was 42 mph. There was also 11.1 inches of snow. There was pea-sized hail observed during a severe thunderstorm on March 31.
April
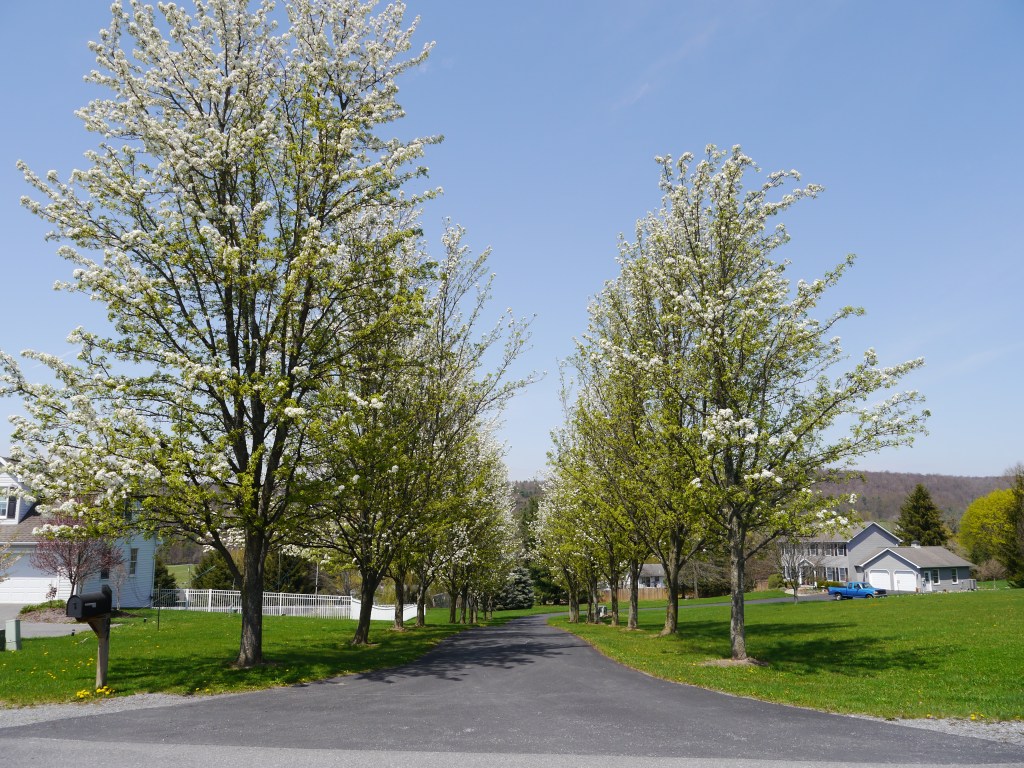
Temperatures were 1.7 F below normal in April. The high was 83.2 F and the low was 26.8 F. Rainfall was 0.67 inches below normal at 2.84 inches. It snowed about 5 inches on April 18. The last day of temperatures below freezing was April 28.
May
Temperatures were 1.8 F above normal with a high of 89.2 F and a low of 34.3 F. Precipitation was 5.22 inches, 1.58 inches above normal. May was the rainiest month of 2022.
June
Temperatures for the month were near normal at 0.1 F above normal. The high for the month, as well as the year, was 92.6 F and the low was 46.9 F. Precipitation was 0.69 inches below normal with 3.40 inches of rainfall. Potential dry conditions were becoming a concern this month.

July
July was the warmest month of 2022. The temperatures were 0.8 F above normal. The high for the month was 91.2 F and the low was 50 F. Rainfall was 1.77 inches below normal with 2.02 inches of precipitation.
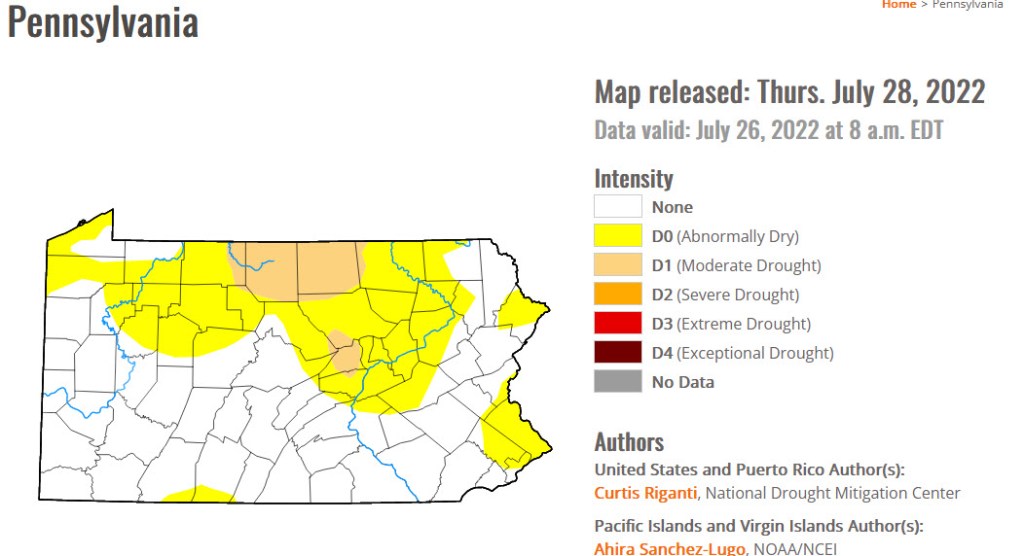
Drought conditions worsened in July:
August
August temperatures were 0.6 F above normal. The high was 89.7 F and the low was 44.99 F. Precipitation was 0.96 inches below normal at 3.20 inches.
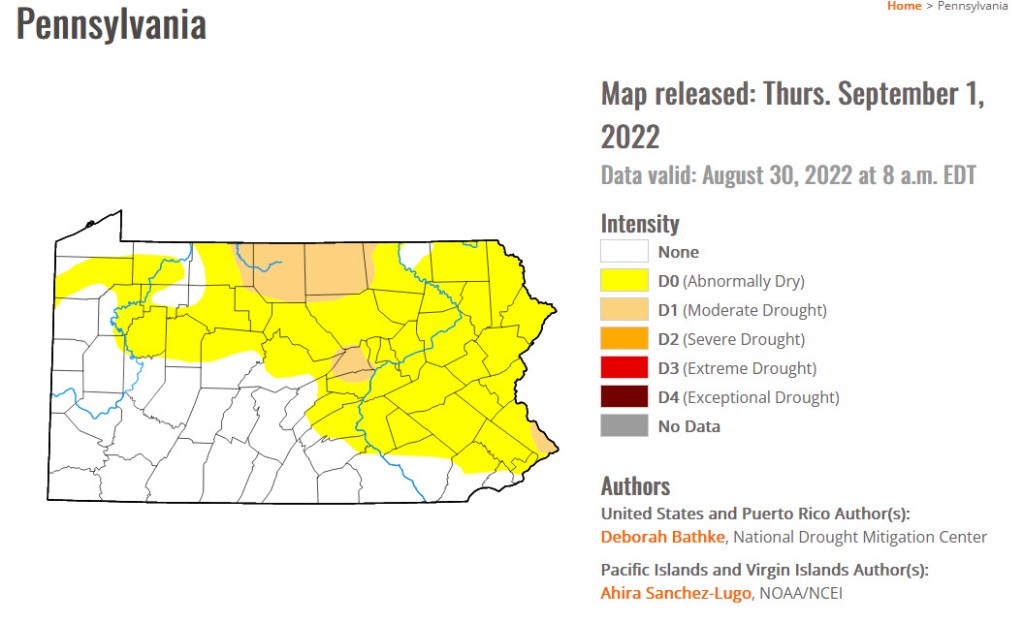
Most of Centre County became abnormally dry:
September

Temperatures were 0.2 F below normal. The high was 87.0 F and the low was 37.3 F. There were 3.72 inches of rainfall, which was 0.21 inches below normal. Dry conditions persisted:

October

October was chilly with temperatures at 2.7 F below normal. The high was 74.2 F and the low was 27.6 F. Rainfall was near normal at 2.05 inches, which was 1.41 inches below normal. The first freeze of the season occurred on October 20.
November
Temperatures in November were mild at 2.5 F above normal. The high was 77 F and the low was 11 F. Precipitation was 4.99 inches, 2.00 inches above normal. The remnants from Hurricane Nicole caused over 3″ of rainfall during November 11-12. There were 5 inches of snow recorded on November 15.
December

December was 1.4 deg F below normal for temperature. The high for the month was 59.3 deg. F, recorded on December 7. The low for the month was -2.3 deg F, recorded on December 23. The temperature plunged over 35 F in 12 hours on December 23:

The hard freeze damaged one polycarbonate measuring tube:

December was an above-normal month for precipitation with 3.32 inches of liquid precipitation recorded, which was 0.14 inches above normal. There were 4.5 inches of snow.
2022 Insolation
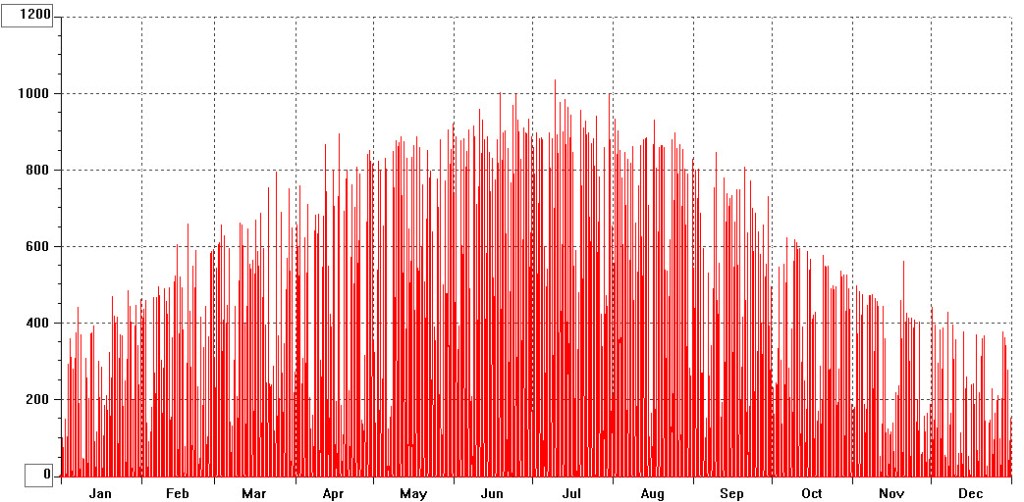

Can you explain more about the Solar Radiation chart? I’m assuming these data points are one per day, and recording the total for each whole day. I’m further assuming that cloudy days cause the frequent drops. Is it possible to plot the average over a week in addition to the daily total? Is there a numeric total for the year? Also, was this data you gathered with a sensor (brand/model/data gathering method), or is the data from a nearby NWS instrument? Thanks! John Balogh – planning a home solar system in case that wasn’t obvious 🙂
LikeLike
These photos are amazing! They’d be perfect for calendar pages.
LikeLike
Thanks!
LikeLike