November was 3.7 deg F above normal for temperature. The high for the month was 76.0 deg. F, recorded on November 8. The low for the month was 22.0 deg F, recorded on November 19. There were 8 days at or below 32 F and 0 days when the maximum temperature was at or below 32 F. There were 593 heating degree days and 8 cooling degree days.
November was a above-normal month for precipitation with 3.44 inches of rainfall recorded, which was 0.20 inches above normal. The maximum rainfall in a single day was 1.24 inches recorded on November 11. There were 9 days of rain >.01 in, 8 >.10 in and 1 > 1 in.
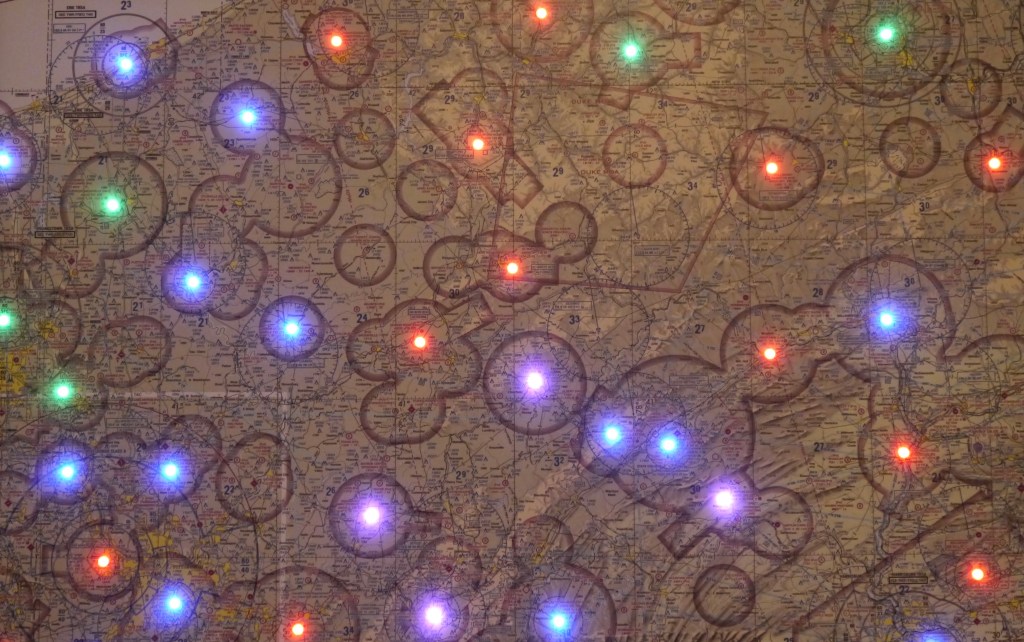
For an anniversary gift I ordered and received the following framed map from my wife.
METAR LED map.
It is an aviation map of western Pennsylvania with a multicolor LED placed at each airport location that issues METARs (METeorological Terminal Aviation routine weather Report). The color of each LED indicates the ceiling and visibility.
Color Code
VFR (>3000ft ceilings and >5nm visibility) = Green
MFR (1000-3000ft ceilings and 3-5nm visibility) = Blue
IFR (500-1000ft ceilings and 1-3nm visibility) = Red
LIFR (<500ft ceilings or <1nm visibility) = Purple
Smoke = Gray
METAR older than 6 hours = Blank
METAR data are processed by a Raspberry Pi, a low-cost single-board computer, which is fastened behind the map. Data are received via a WiFi connection every five minutes. The brightness of the LEDs also changes for day/night conditions.
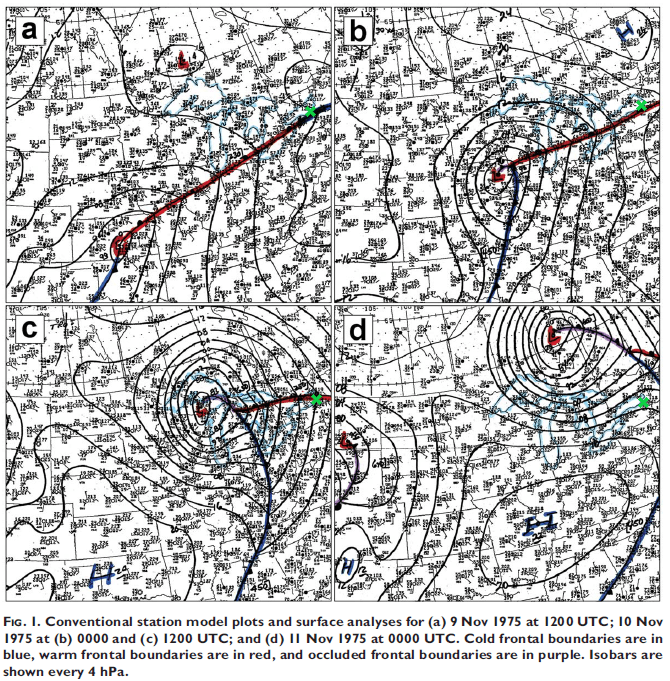
Today is the 45th anniversary of the wreck of The Edmund Fitzgerald. A colleague of mine, and former roommate at SUNY-Oswego, asked if the storm that sank the ship, also affected Oswego, NY, on that fateful day (November 10, 1975). One of the advantages of being retired is having the time to do such research.
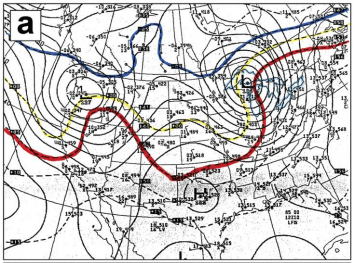
Synoptic Charts for November 10, 1975, Oswego, NY marked by the green crosses.850 mb Analysis for November 10, 1975 1200 UTC. -5 C, 0 C, 5 C isotherms marked by the blue, yellow and red lines, respectively.
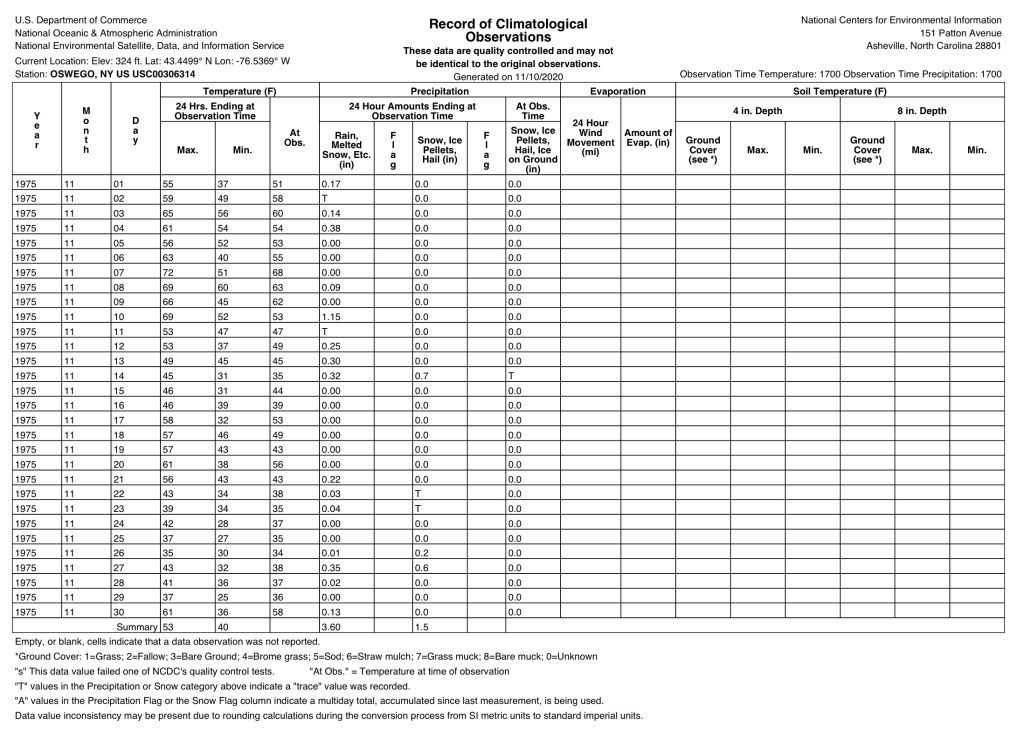
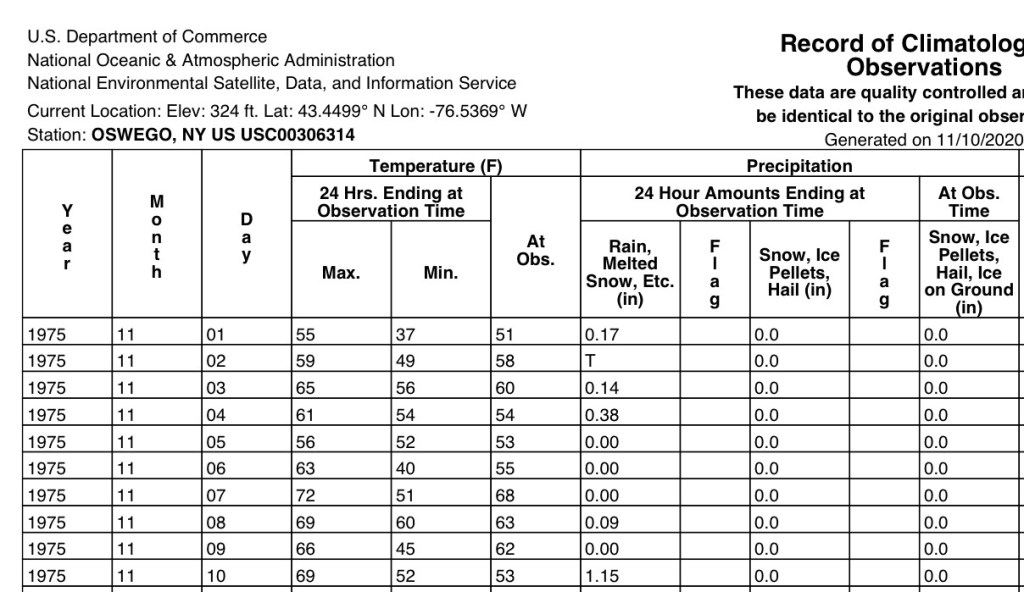
Weather data for Oswego, NY,November 1975.Enlarged Image of Oswego Data for November 1975
The high of 69 F and low of 52 F, quite warm for that time of year, confirms that Oswego, was in the warm sector of the storm system as a warm front passed through the area. The surface and 850 mb analysis shows the winds in Oswego were from the south and not off Lake Ontario. Exact wind speeds can not be ascertained from the charts, but judging from the tight isobars and geopotential isopleths, it was probably brisk and accounts for the warm air advection. Also, 1.15 inches of rain fell during the day. A cold front moved through later that evening.
So The Edmund Fitzgerald Storm did affect SUNY-Oswego on Monday, November 10, 1975.
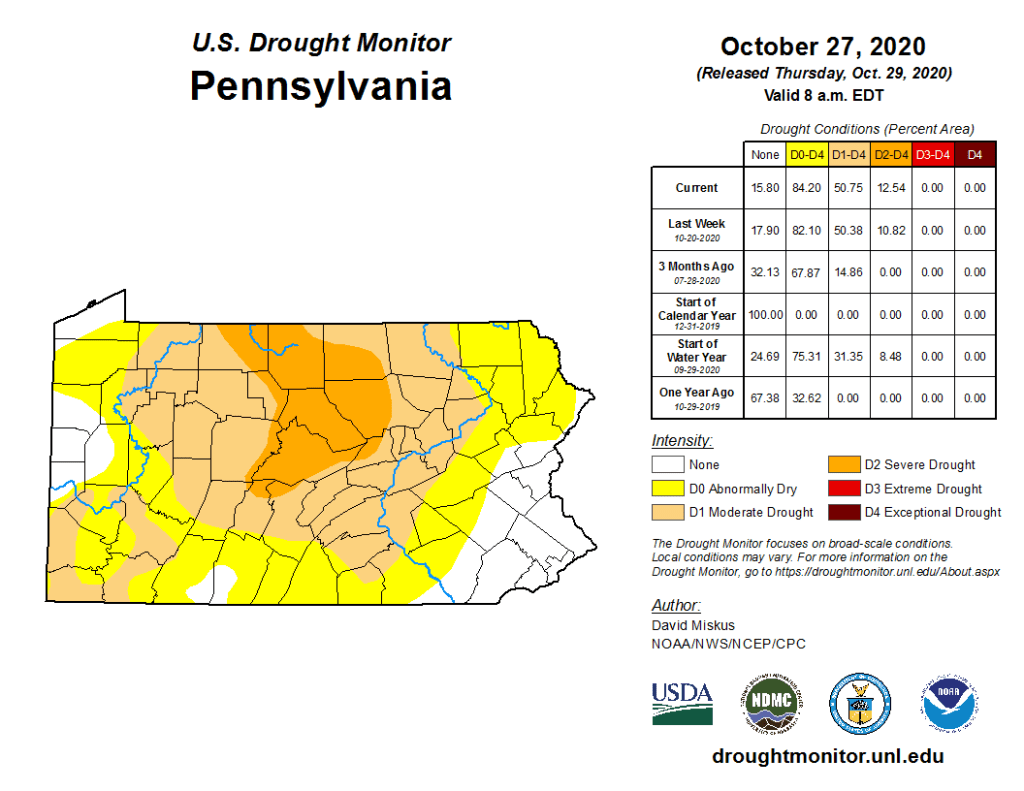
October was 1.0 deg F above normal for temperature. The high for the month was 80.6 deg. F recorded on October 22. The low for the month was 27.7 deg F, recorded on Oct 17. There were 0 days at or above 90 deg F and 1 day at or below 32 deg F. There were 412 heating degree days and 21 cooling degree days.
The drought continued into October with below normal precipitation of 2.96 inches of rainfall recorded, which was 0.38 inches below normal. The maximum rainfall in a single day was 1.16 inches recorded on October 29. There were 15 days of rain >.01 in, 8 >.10 in and 1 > 1 in.
August was 2.2 deg F above normal for temperature. The high for the month was 93.1 deg. F recorded on August 22. The low for the month was 47.0 deg F, recorded on August 20. There were 6 days at or above 90 deg F. There were 24 heating degree days and 259 cooling degree days.
August was a below normal month for precipitation with 1.48 inches of rainfall recorded, which was 0.72 inches below normal. The maximum rainfall in a single day was 0.75 inches recorded on August 28. There were 8 days of rain >.01 in, 3 >.10 in and 0 >1 in.
Meteorological Summer is officially over. Here is a brief summary of June 1-August 31 in Stormstown, PA:
Number of days Max T >= 90 F: 18
Max T: 95.1 – July 18, 2020
Min T: 40.9 – June 1, 2020
Jun Dep from Normal: 0.1
Jul Dep from Normal: 3.8
Aug Dep from Normal: 2.2
Heating Degree Days: 108 Cooling Degree Days: 761
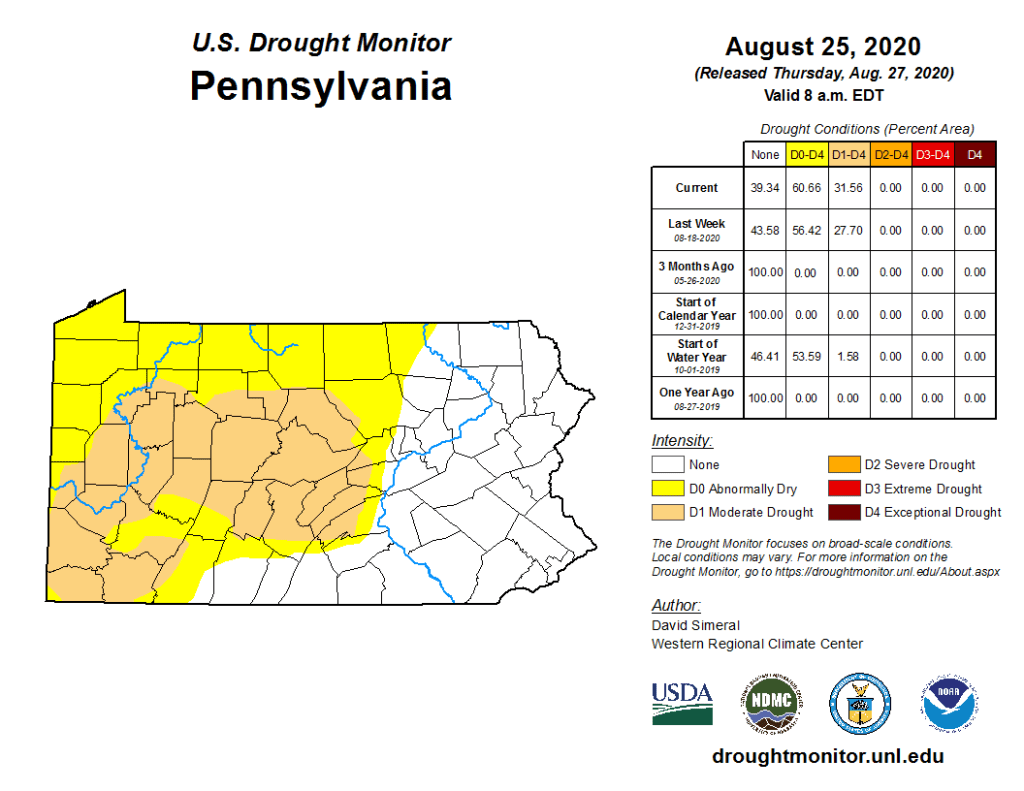
The main feature of the summer was the moderate drought conditions that developed during July and August. All of Centre County experienced those conditions. Between June 10, 2020, when it rained 0.91″ and August 28, 2020, when it rained 0.75″, there wasn’t a single day when rainfall exceeded 0.50″. In fact, rainfall has not exceeded 1.00″ of rain, in a day, since June 4.
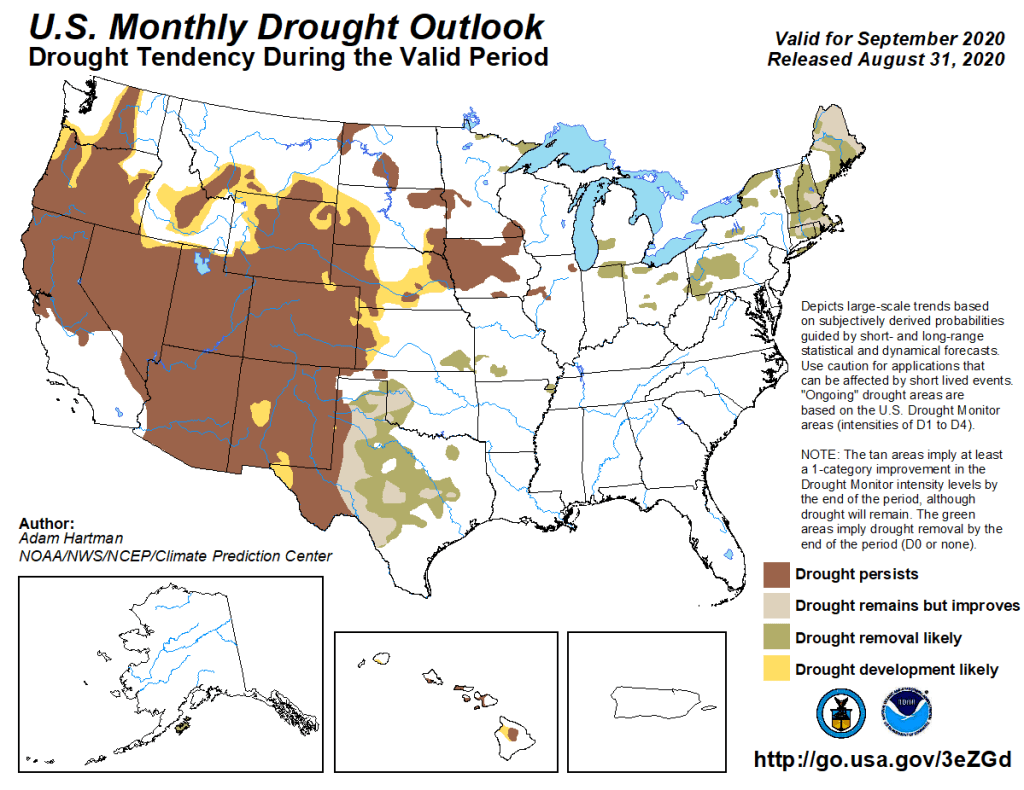
The outlook for September 2020 shows that the drought abatement is likely.
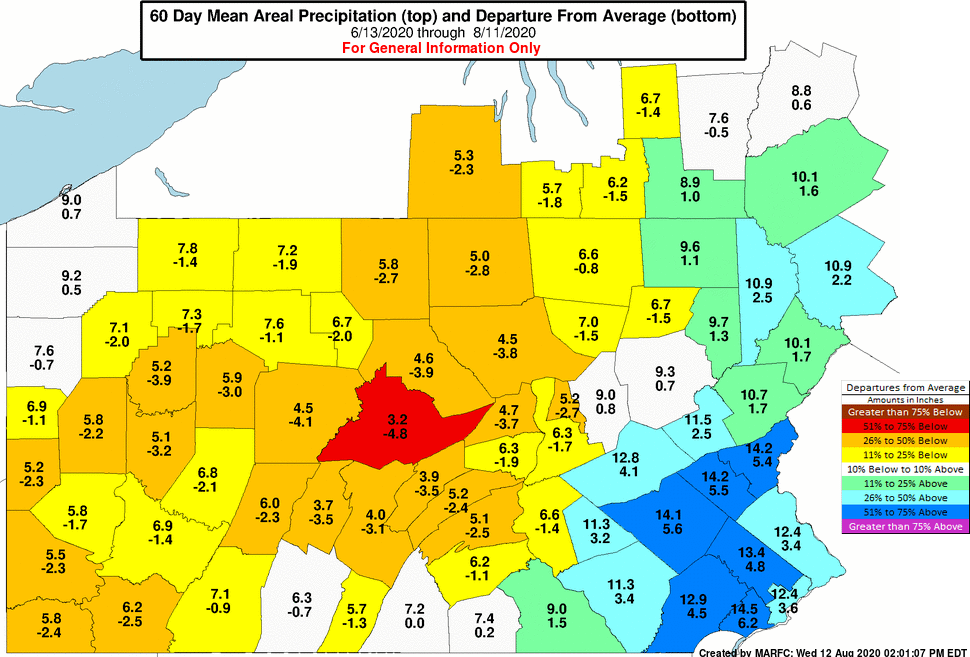
The following was recently posted by the State College National Weather Service Office. The chart was produced by The Mid-Atlantic River Forecast Center (MARFC) which is co-located with The State College National Weather Service Forecast Office.
A neighbor asked to explain why Centre County was depicted as being a standout from the other counties.
For the 60-day period (6/13/2020 through 8/11/2020) Centre County’s areal precipitation was 3.2 inches which was 4.8 inches below normal for the period. A normal amount would have been 8 inches. This works out to be 60% below normal which is above the 50% threshold for the red portion of the scale. By comparison, here are the values for the surrounding counties: Blair 47%, Cambria 29%, Clearfield 47%, Clinton 41%, Huntington 43%, Mifflin 47%, Snyder 44%.
The River Forecast Centers use a distance weighting technique to calculate the areal precipitation. A grid of point estimates is made based on a distance weighting scheme. Each observed point value is given a unique weight for each grid point based on the distance from the grid point in question. The grid point precipitation value is calculated based on the sum of the individual station weight multiplied by observed station value. Once the grid points have all been estimated they are summed and the sum is divided by the number of grid points to obtain the areal average precipitation.
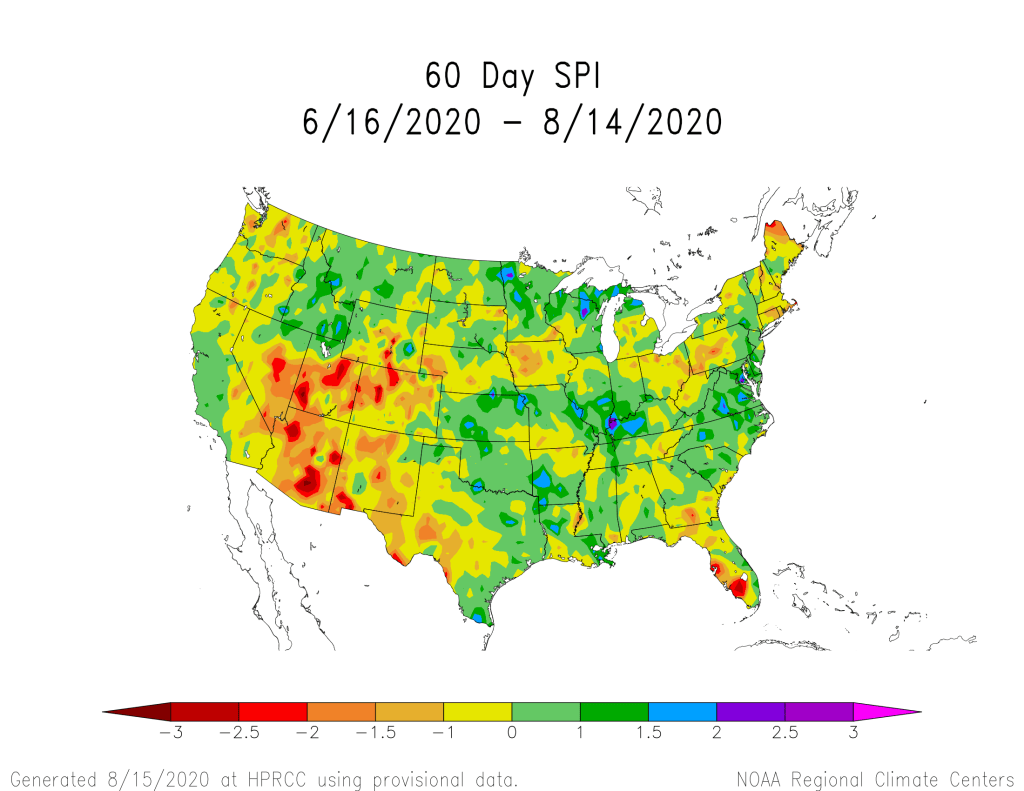
Here is a map of standardized precipitation index (SPI).
There is a bullseye of values between -2 and -1.5 over our region.
The SPI is a widely used index to characterize meteorological drought on a range of timescales. On short timescales, the SPI is closely related to soil moisture, while at longer timescales, the SPI can be related to groundwater and reservoir storage. The SPI uses precipitation only, and can characterize drought or abnormal wetness at different time scales which correspond with the time availability of different water resources (e.g. soil moisture, snowpack, groundwater, river discharge and reservoir storage).
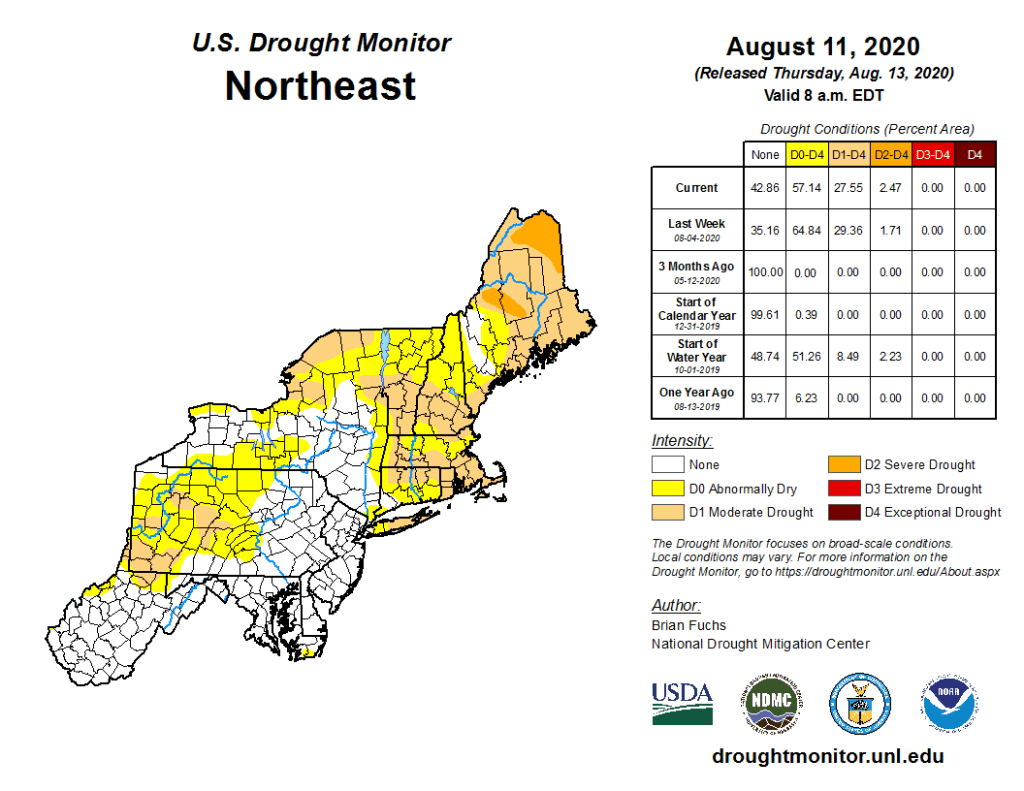
Drought for the Northeast United States
As the above map indicates, southwestern Centre County is experiencing a moderate drought. The criteria for drought classification appears below.
July was lower than normal for precipitation for six counties in central Pennsylvania.
Pennsylvania July 2020 Precipitation by County
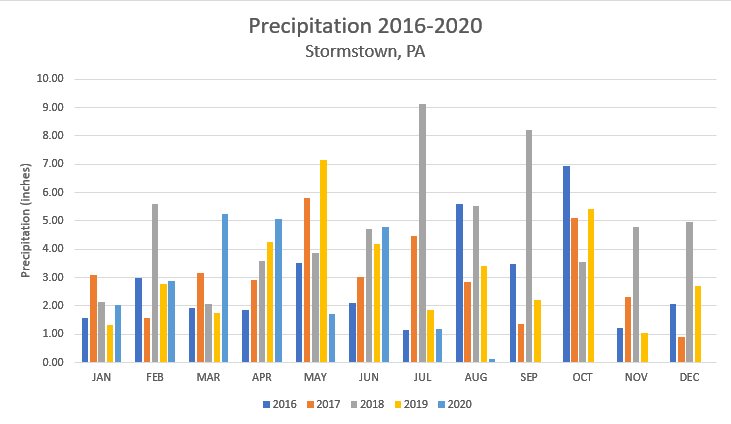
The above graph shows all of the precipitation data I have collected since establishing my weather station in December 2015 until now. This past July was as dry as July 2016. However, August 2020 is on track to be the driest in 5 years.
July was 3.8 deg F above normal for temperature. The high for the month was 95.1 deg. F recorded on July 18. The low for the month was 54.7 deg F, recorded on July 14. There were 12 days at or above 90 deg F. There were 13 heating degree days and 334 cooling degree days.
July was a below normal month for precipitation with 1.19 inches of rainfall recorded, which was 2.27 inches below normal. The maximum rainfall in a single day was 0.33 inches recorded on July 31. There were 9 days of rain >.01 in, 4 >.10 in and 0 >1 in.
June was 0.1 deg F above normal for temperature. The high for the month was 88 deg. F recorded on June 9. The low for the month was 41 deg F, recorded on June 1. There were 71 heating degree days and 168 cooling degree days.
June was an above normal month for precipitation with 4.80 inches of rainfall recorded, which was 0.94 inches above normal. The maximum rainfall in a single day was 1.56 inches recorded on June 4. There were 8 days of rain >.01 in, 7 >.10 in and 1 >1 in.