November was 3.1 deg F above normal for temperature. The high for the month was 72.2 deg. F, recorded on November 6. The low for the month was 20.9 deg F, recorded on November 30. There were 10 days at or below 32 F and 1 day when the maximum temperature was at or below 32 F. There were 730 heating degree days and 0 cooling degree days.
November was a below-normal month for precipitation with 2.55 inches of rainfall recorded, 0.44 inches below normal. The maximum rainfall in a single day was 0.68 inches recorded on November 10. There were 11 days of rain >.01 in, 6 >.10 in, and 0 > 1 in.
The first snowfall of the season was on November 22.
High wind speed of 30 mph on November 20.
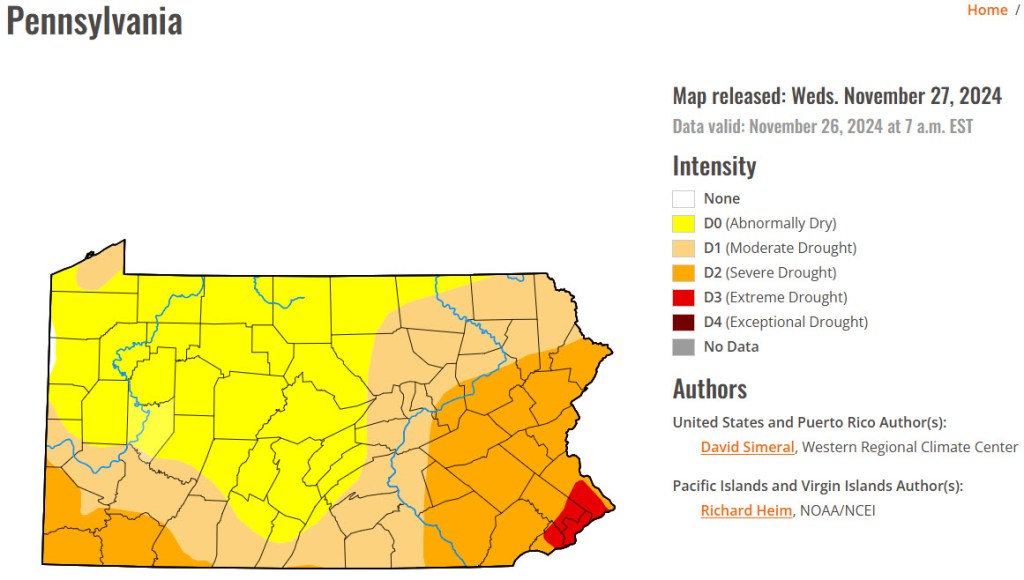
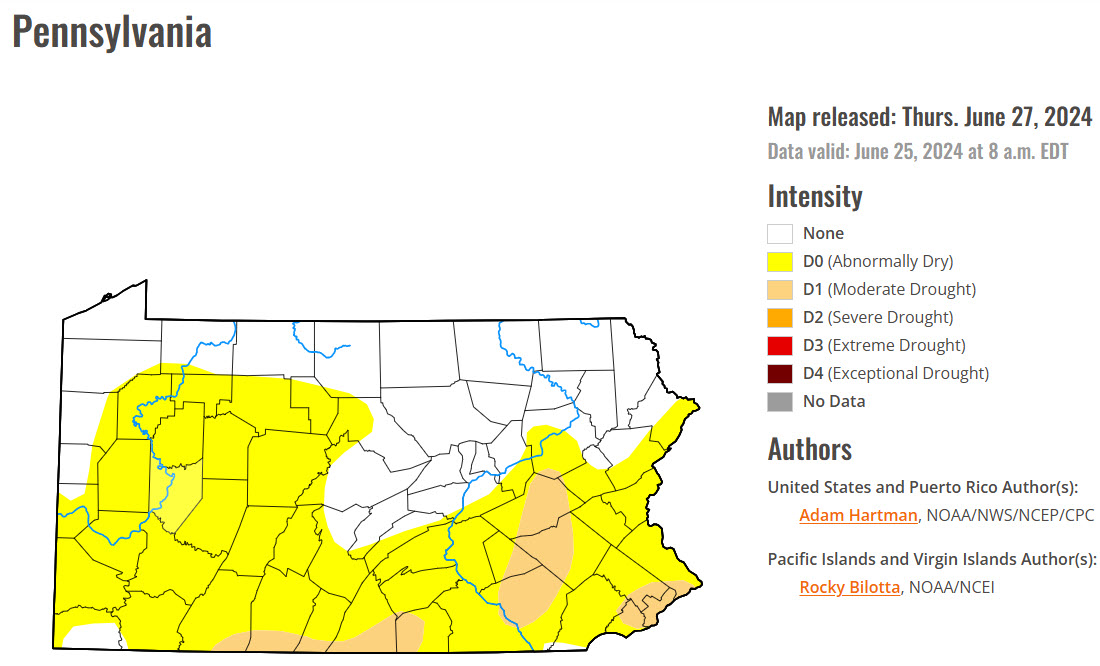
Current Drought Data