July 2023 Weather Summary

July was a normal month for temperature. The high for the month was 89.9 deg. F recorded on July 28. The low for the month was 54.6 deg F, recorded on July 31. There were no days at or above 90 deg F. There were 17 heating degree days and 240 cooling degree days.

July was an above-normal month for precipitation with 6.39 inches of rainfall recorded, which was 2.60 inches above normal. The maximum rainfall in a single day was 1.03 inches recorded on July 20. There were 15 days of rain >.01 in, 11 >.10 in, and 2 >1 in.

High wind speed of 37 mph on July 20.

July 2023 Data

Summary of Winter 2022-2023

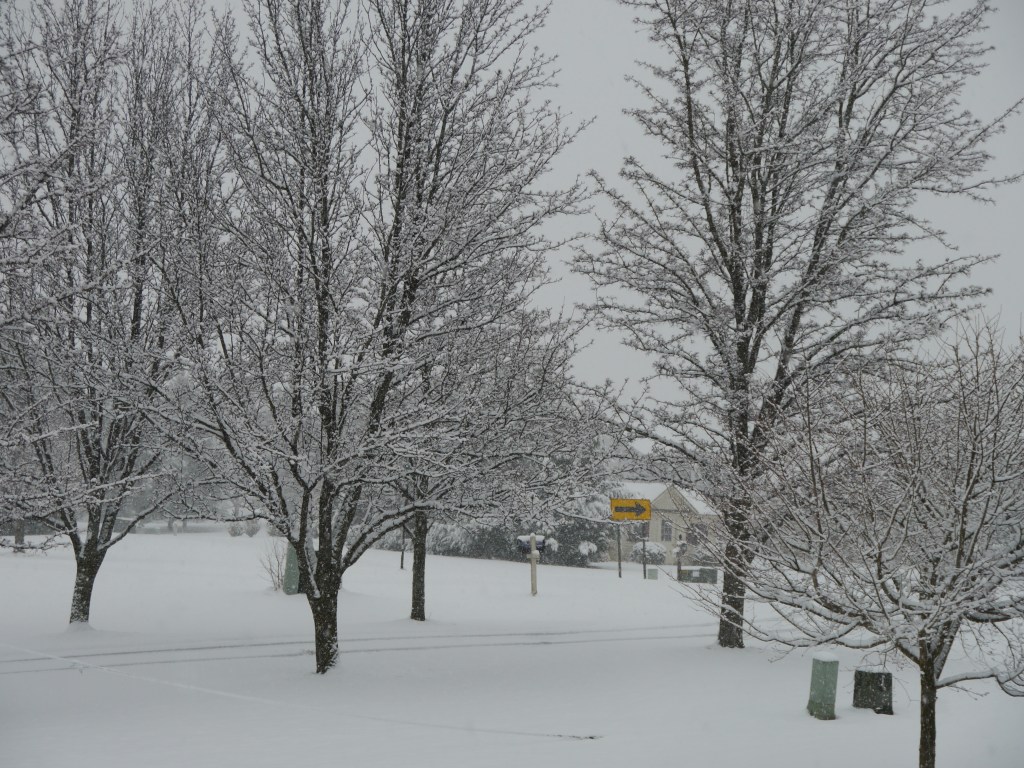
Meteorological Winter is officially over. Here is a brief summary of December 1, 2022-February 28, 2023 in Stormstown, PA:

Number of Days Max T <= 32 F: 9  

Number of Days Min T <= 32 F: 66 

Number of Days Min T <= 0 F: 2  

Max T: 70.9 F – February 15, 2023  

Min T: -2.3 F – December 7, 2022

Dec Dep from Normal: -1.4 F  

Jan Dep from Normal: 9.5 F  

Feb Dep from Normal: 7.9 F  

Heating Degree Days: 2725 

Cooling Degree Days: 2 

Dec Precip: 3.32″, 0.14″ above normal  

Jan Precip: 3.35″, 0.43″ above normal  

Feb Precip: 1.99″, 0.47″ below normal  

2022 Stormstown Weather Summary

Overall, the year’s temperatures were slightly above normal. The annual mean of 50.5 F was 0.2 F above normal. The annual precipitation of 39.66 inches was 1.87 inches below normal.

2022 Weather Data

January

January was the coldest month of 2022 and was colder than normal with a monthly mean of 24.3 F, which was -2.9 F below normal, with a high of 53.8 F and a low for the month of -6.2 F, which was also the low for the year.. Precipitation was 1.63 inches below normal with 1.29 inches of liquid precipitation. There were 13.8 inches of snow this month.

February

February was an above-normal month for temperature, with a mean of 30.8 F, which was 1.7 F above normal. The high was 11.8 F and the low was 5.7 F. Precipitation was 1.88 inches above normal at 4.34 inches. There were 3.4 inches of snow for the month, with a maximum daily total of 1.7 inches on February 25.

March

March temperatures were also mild at 4.1 F above normal with a high of 71.5 F and a low of 12.5 F. Precipitation was 0.13 inches below normal with 3.25 inches of liquid precipitation. The high wind speed for the month and year was 42 mph. There was also 11.1 inches of snow. There was pea-sized hail observed during a severe thunderstorm on March 31.

April

Temperatures were 1.7 F below normal in April. The high was 83.2 F and the low was 26.8 F. Rainfall was 0.67 inches below normal at 2.84 inches. It snowed about 5 inches on April 18. The last day of temperatures below freezing was April 28.

May

Temperatures were 1.8 F above normal with a high of 89.2 F and a low of 34.3 F. Precipitation was 5.22 inches, 1.58 inches above normal. May was the rainiest month of 2022.

June

Temperatures for the month were near normal at 0.1 F above normal. The high for the month, as well as the year, was 92.6 F and the low was 46.9 F. Precipitation was 0.69 inches below normal with 3.40 inches of rainfall. Potential dry conditions were becoming a concern this month.

July

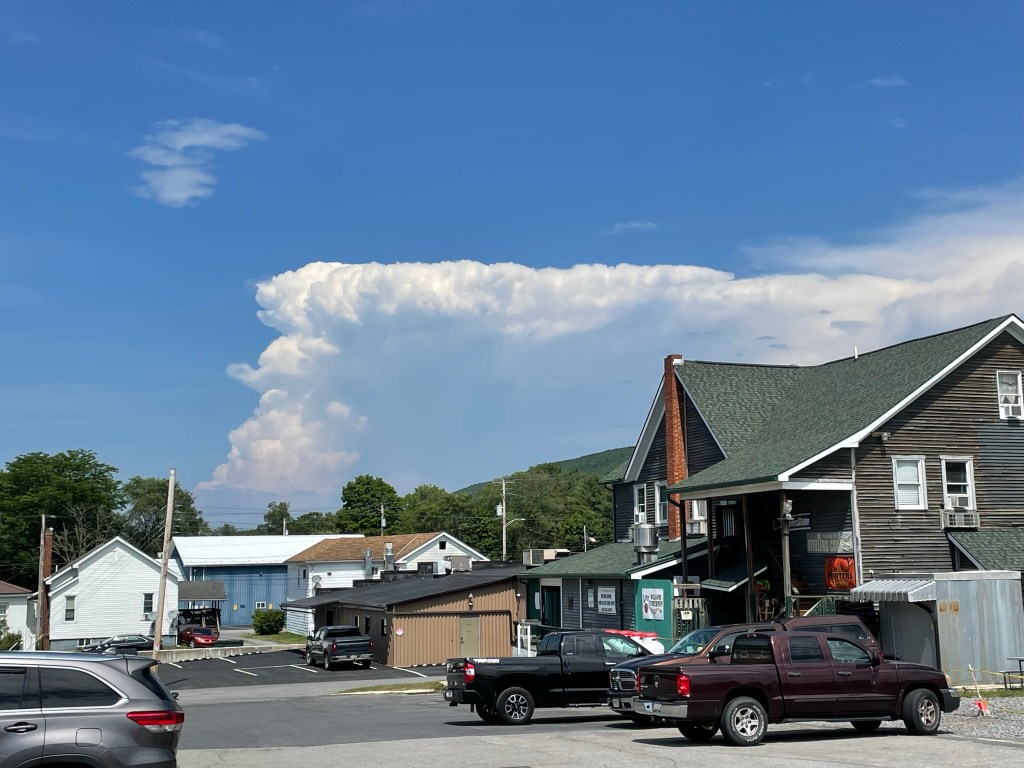
Thunderstorm north of Port Matilda, PA

July was the warmest month of 2022. The temperatures were 0.8 F above normal. The high for the month was 91.2 F and the low was 50 F. Rainfall was 1.77 inches below normal with 2.02 inches of precipitation.

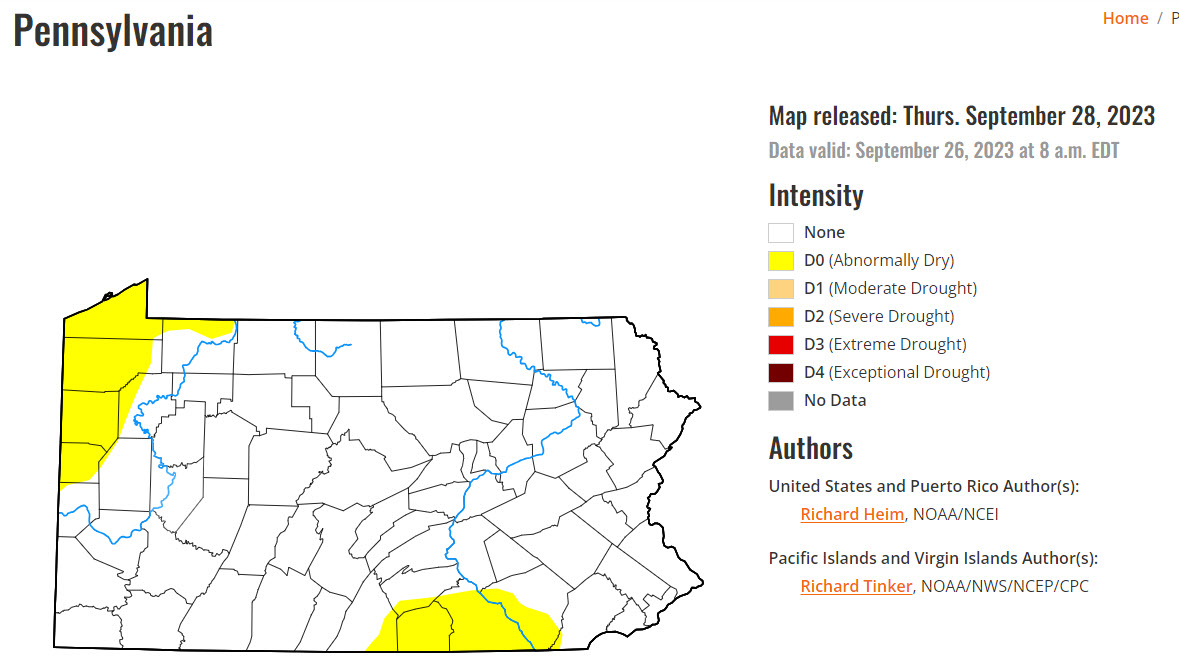
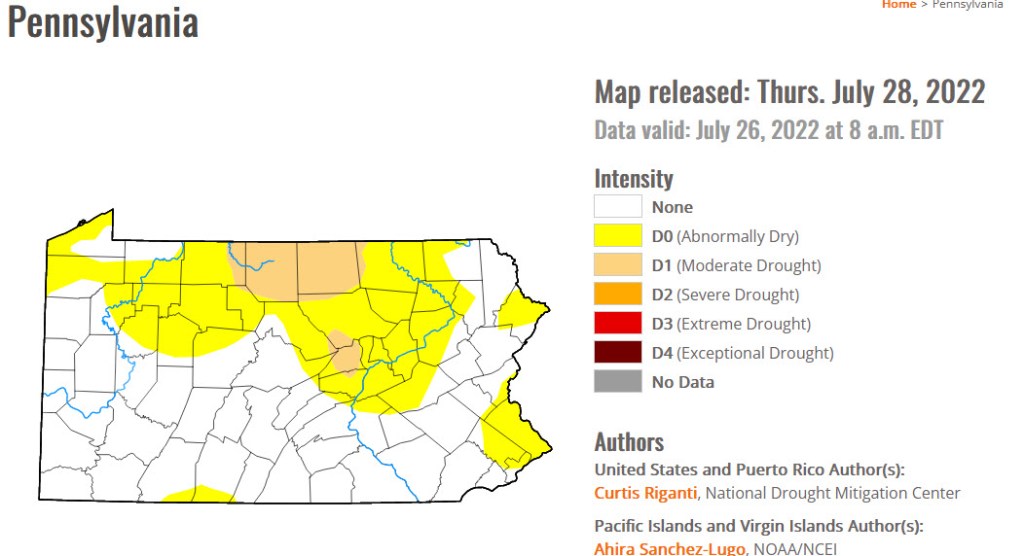
Drought conditions worsened in July:

August

August temperatures were 0.6 F above normal. The high was 89.7 F and the low was 44.99 F. Precipitation was 0.96 inches below normal at 3.20 inches.

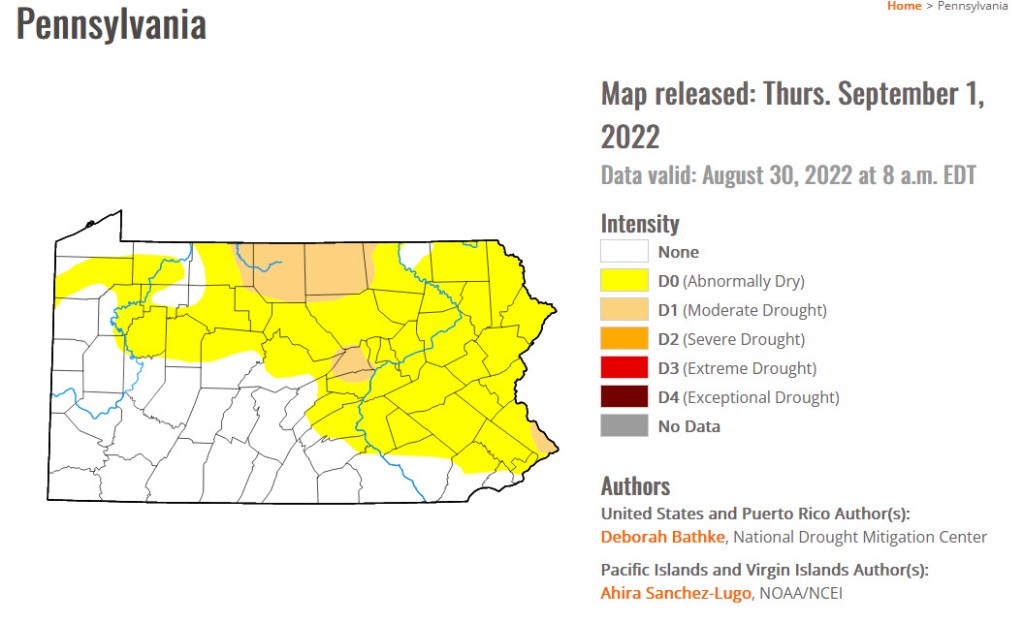
Most of Centre County became abnormally dry:

September

Temperatures were 0.2 F below normal. The high was 87.0 F and the low was 37.3 F. There were 3.72 inches of rainfall, which was 0.21 inches below normal. Dry conditions persisted:

October

October was chilly with temperatures at 2.7 F below normal. The high was 74.2 F and the low was 27.6 F. Rainfall was near normal at 2.05 inches, which was 1.41 inches below normal. The first freeze of the season occurred on October 20.

November

Temperatures in November were mild at 2.5 F above normal. The high was 77 F and the low was 11 F. Precipitation was 4.99 inches, 2.00 inches above normal. The remnants from Hurricane Nicole caused over 3″ of rainfall during November 11-12. There were 5 inches of snow recorded on November 15.

December

December was 1.4 deg F below normal for temperature. The high for the month was 59.3 deg. F, recorded on December 7. The low for the month was -2.3 deg F, recorded on December 23. The temperature plunged over 35 F in 12 hours on December 23:

The hard freeze damaged one polycarbonate measuring tube:

December was an above-normal month for precipitation with 3.32 inches of liquid precipitation recorded, which was 0.14 inches above normal. There were 4.5 inches of snow.

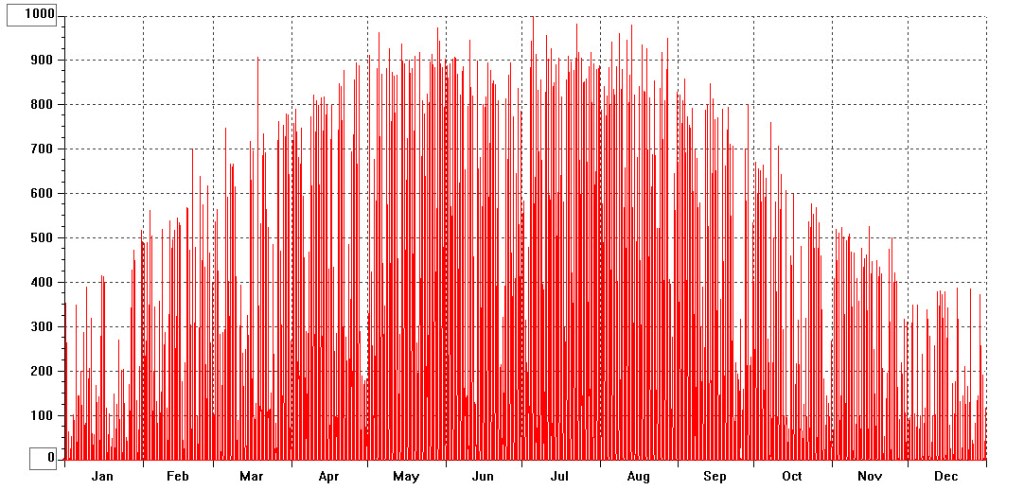
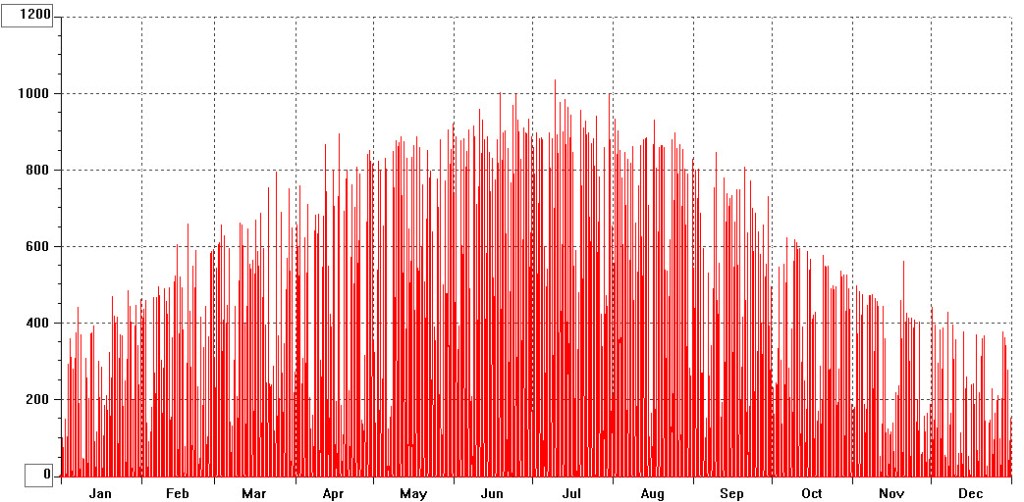
2022 Insolation

2022 Daily Solar Radiation (W/m**2)

July 2022 Weather Summary

July was 0.8 deg F above normal for temperature. The high for the month was 91.2 deg. F recorded on July 23. The low for the month was 50.0 deg F, recorded on July 4. There were 3 days at or above 90 deg F. There were 27 heating degree days and 275 cooling degree days.

July was a below-normal month for precipitation with 2.02 inches of rainfall recorded, which was 1.77 inches below normal. The maximum rainfall in a single day was 0.46 inches recorded on July 7. There were 8 days of rain >.01 in, 6 >.10 in, and 0 >1 in.

High wind speed of 26 mph on July 23.

July 2022 Data

December 2021 Weather Summary

December was 6.9 deg F above normal for temperature. The high for the month was 65.9 deg. F, recorded on December 16. The low for the month was 15.8 deg F, recorded on December 20. There were 17 days when the minimum temperature was at or below 32 F and 0 days when the maximum temperature was at or below 32 F. There were 816 heating degree days and 0 cooling degree days.

December was a below-normal month for precipitation with 2.69 inches of rainfall recorded, which was 0.44 inches below normal. The maximum rainfall in a single day was 1.05 inches recorded on December 28. There were 12 days of rain >.01 in, 7 >.10 in and 1 > 1 in.

High wind speed of 40 mph on December 11.

Snowfall for December: 3.0 inches

December 2021 Data

July 2021 Weather Summary

July was 0.4 deg F below normal for temperature. The high for the month was 91.8 deg. F recorded on July 7. The low for the month was 49.6 deg F, recorded on July 31. There was a single day at or above 90 deg F! There were 32 heating degree days and 224 cooling degree days.

July was a below normal month for precipitation with 3.08 inches of rainfall recorded, which was 0.38 inches below normal. The maximum rainfall in a single day was 0.69 inches recorded on July 7. There were 12 days of rain >.01 in, 7 >.10 in and 0 >1 in.

High wind speed of 43 mph on July 7.

July 2021 Data

December 2020 Weather Summary

December was 0.8 deg F above normal for temperature. The high for the month was 55.3 deg. F, recorded on December 11. The low for the month was 12.9 deg F, recorded on December 19. There were 25 days when the minimum temperature was at or below 32 F and 5 days when the maximum temperature was at or below 32 F. There were 1003 heating degree days and 0 cooling degree days.

December was a near-normal month for precipitation with 3.03 inches of rainfall recorded, which was 0.10 inches below normal. The maximum rainfall in a single day was 1.88 inches recorded on December 24. There were 12 days of rain >.01 in, 5 >.10 in and 1 > 1 in.

High wind speed of 36 mph on December 2.

Snowfall on December 16-17: 15.5 inches

December 2020 Data

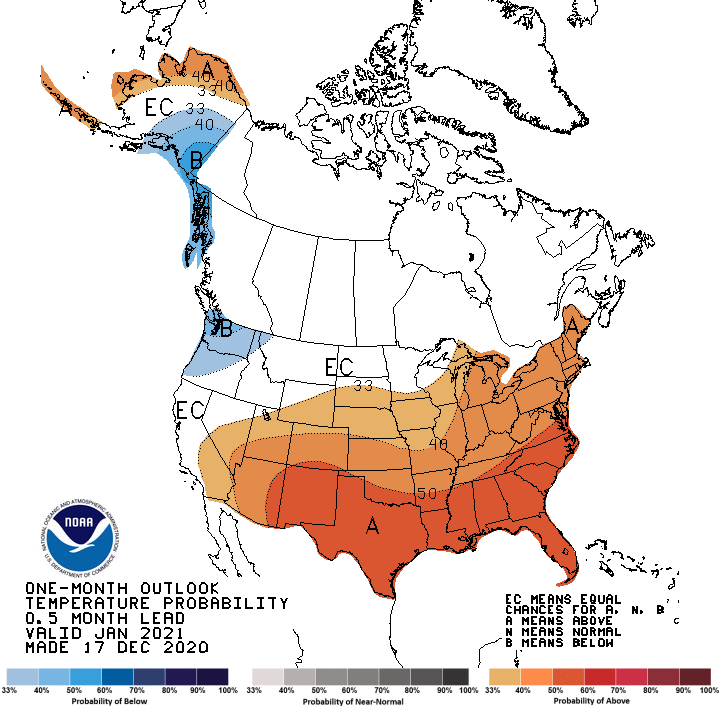
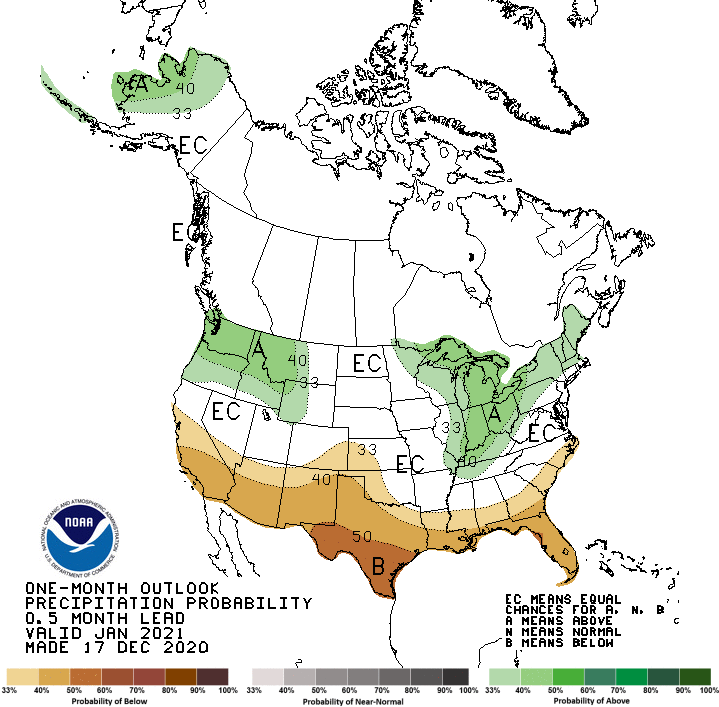
Outlook for January 2021

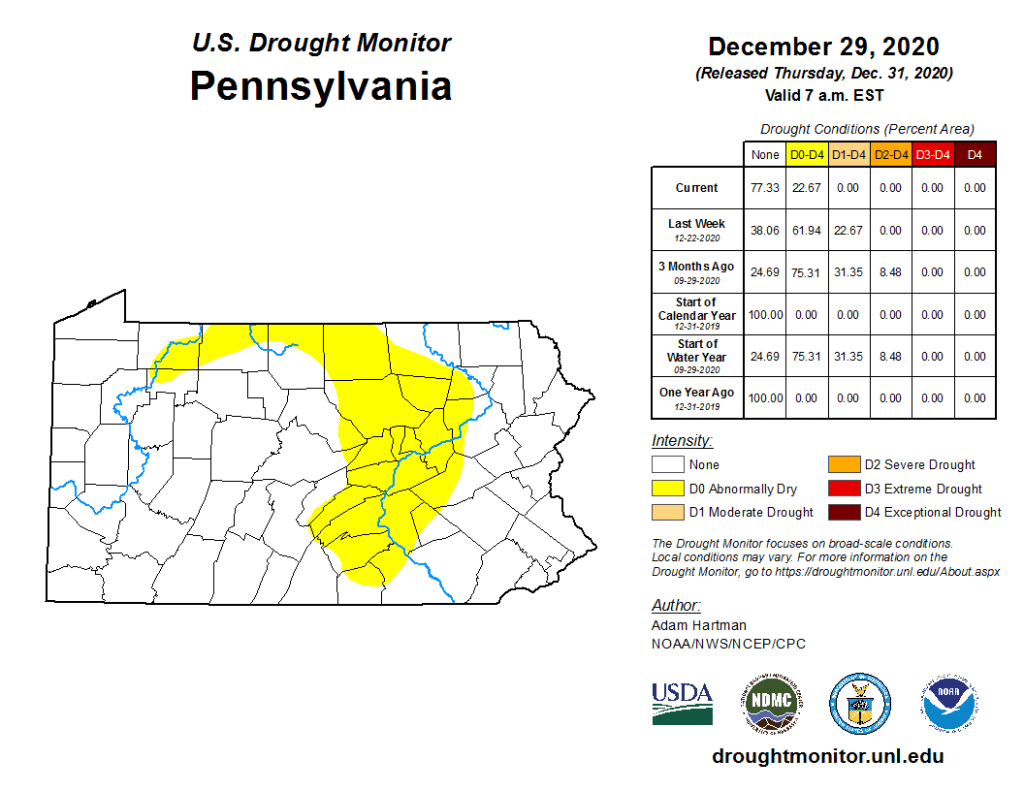
The drought in Centre County is essentially over.

November 2020 Weather Summary

November was 3.7 deg F above normal for temperature. The high for the month was 76.0 deg. F, recorded on November 8. The low for the month was 22.0 deg F, recorded on November 19. There were 8 days at or below 32 F and 0 days when the maximum temperature was at or below 32 F. There were 593 heating degree days and 8 cooling degree days.

November was a above-normal month for precipitation with 3.44 inches of rainfall recorded, which was 0.20 inches above normal. The maximum rainfall in a single day was 1.24 inches recorded on November 11. There were 9 days of rain >.01 in, 8 >.10 in and 1 > 1 in.

High wind speed of 39 mph on November 1.

November 2020 Data

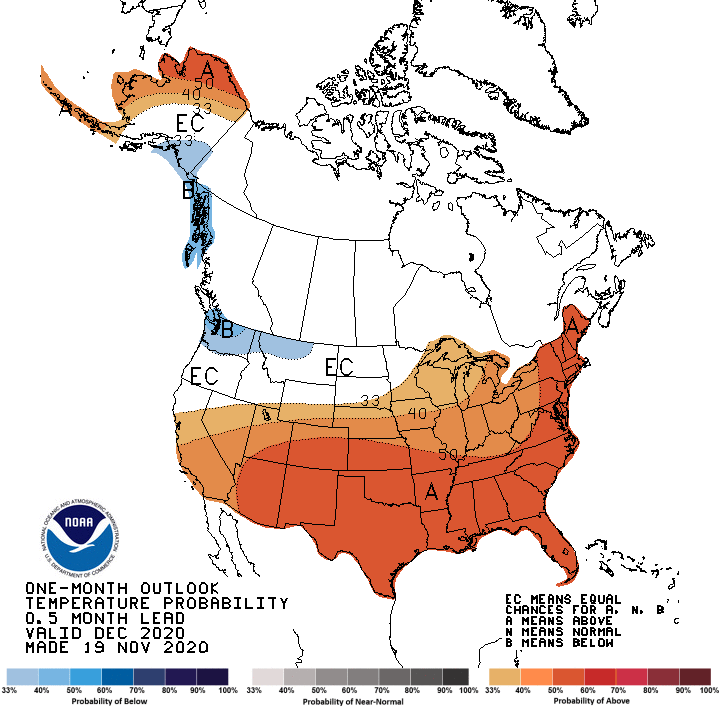
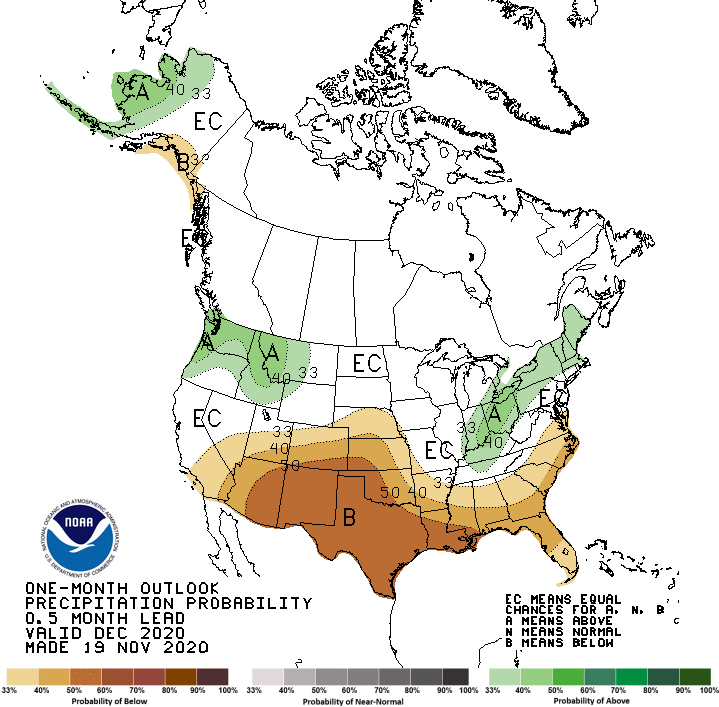
Outlook for December 2020

May 2020 Weather Summary

May was 1.8 deg F below normal for temperature. The high for the month was 86 F, recorded on May 26. The low for the month was 27.2 deg F, recorded on May 9. There were 3 days at or below 32 F. There were 291 heating degree days and 54 cooling degree days.

May was a below-normal month for precipitation with 1.72 inches of rainfall recorded, which was 1.51 inches below normal. The maximum rainfall in a single day was 0.43 inches recorded on May 6. There were 11 days of rain >.01 in, 4 >.10 in and 0 > 1 in.

High wind speed of 38 mph on May 9.

May 2020 Data

Outlook for June 2020

December 2019 Weather Summary

December was 1.8 deg F above normal for temperature. The high for the month was 56.9 deg. F, recorded on December 23. The low for the month was 12.3 deg F, recorded on December 20. There were 23 days at or below 32 F and 3 days when the maximum temperature was at or below 32 F. There were 973 heating degree days and 0 cooling degree days.

December was a below-normal month for precipitation with 2.69 inches of rainfall recorded, which was 0.44 inches below normal. The maximum rainfall in a single day was 0.71 inches recorded on December 9. There were 12 days of rain >.01 in, 7 >.10 in and 0 > 1 in.

High wind speed of 34 mph on December 18.

December 2019 Data

Outlook for January 2020