November was 3.7 deg F above normal for temperature. The high for the month was 76.0 deg. F, recorded on November 8. The low for the month was 22.0 deg F, recorded on November 19. There were 8 days at or below 32 F and 0 days when the maximum temperature was at or below 32 F. There were 593 heating degree days and 8 cooling degree days.
November was a above-normal month for precipitation with 3.44 inches of rainfall recorded, which was 0.20 inches above normal. The maximum rainfall in a single day was 1.24 inches recorded on November 11. There were 9 days of rain >.01 in, 8 >.10 in and 1 > 1 in.
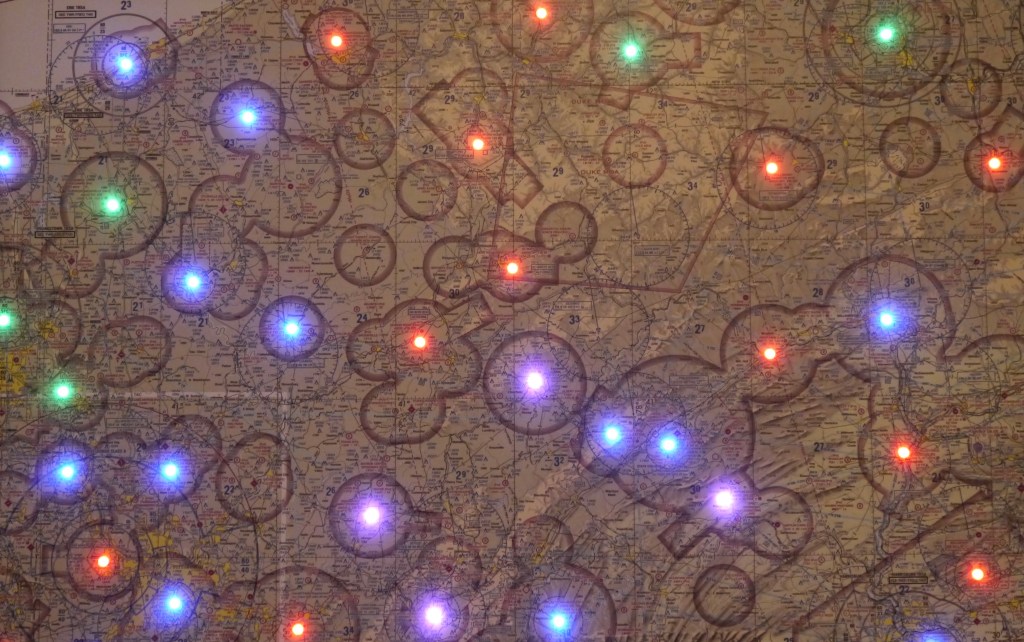
For an anniversary gift I ordered and received the following framed map from my wife.
METAR LED map.
It is an aviation map of western Pennsylvania with a multicolor LED placed at each airport location that issues METARs (METeorological Terminal Aviation routine weather Report). The color of each LED indicates the ceiling and visibility.
Color Code
VFR (>3000ft ceilings and >5nm visibility) = Green
MFR (1000-3000ft ceilings and 3-5nm visibility) = Blue
IFR (500-1000ft ceilings and 1-3nm visibility) = Red
LIFR (<500ft ceilings or <1nm visibility) = Purple
Smoke = Gray
METAR older than 6 hours = Blank
METAR data are processed by a Raspberry Pi, a low-cost single-board computer, which is fastened behind the map. Data are received via a WiFi connection every five minutes. The brightness of the LEDs also changes for day/night conditions.
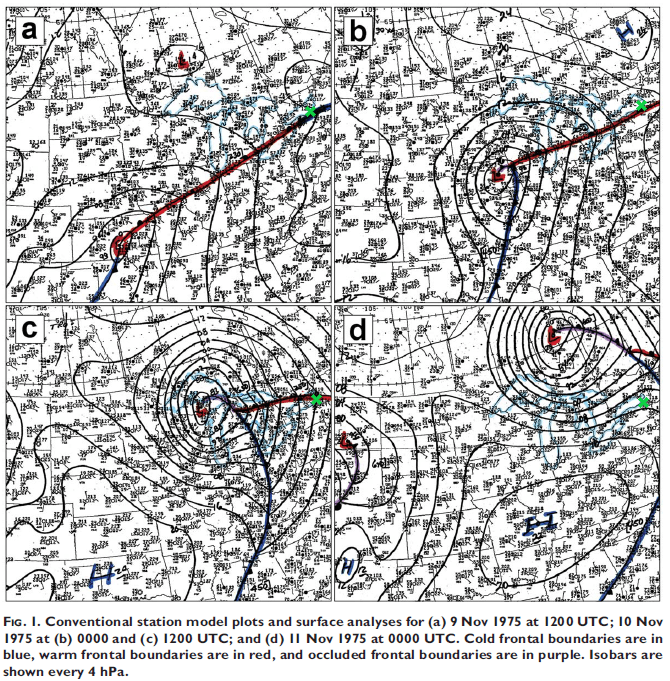
Today is the 45th anniversary of the wreck of The Edmund Fitzgerald. A colleague of mine, and former roommate at SUNY-Oswego, asked if the storm that sank the ship, also affected Oswego, NY, on that fateful day (November 10, 1975). One of the advantages of being retired is having the time to do such research.
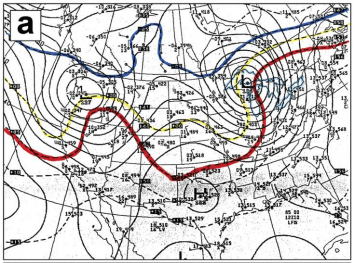
Synoptic Charts for November 10, 1975, Oswego, NY marked by the green crosses.850 mb Analysis for November 10, 1975 1200 UTC. -5 C, 0 C, 5 C isotherms marked by the blue, yellow and red lines, respectively.
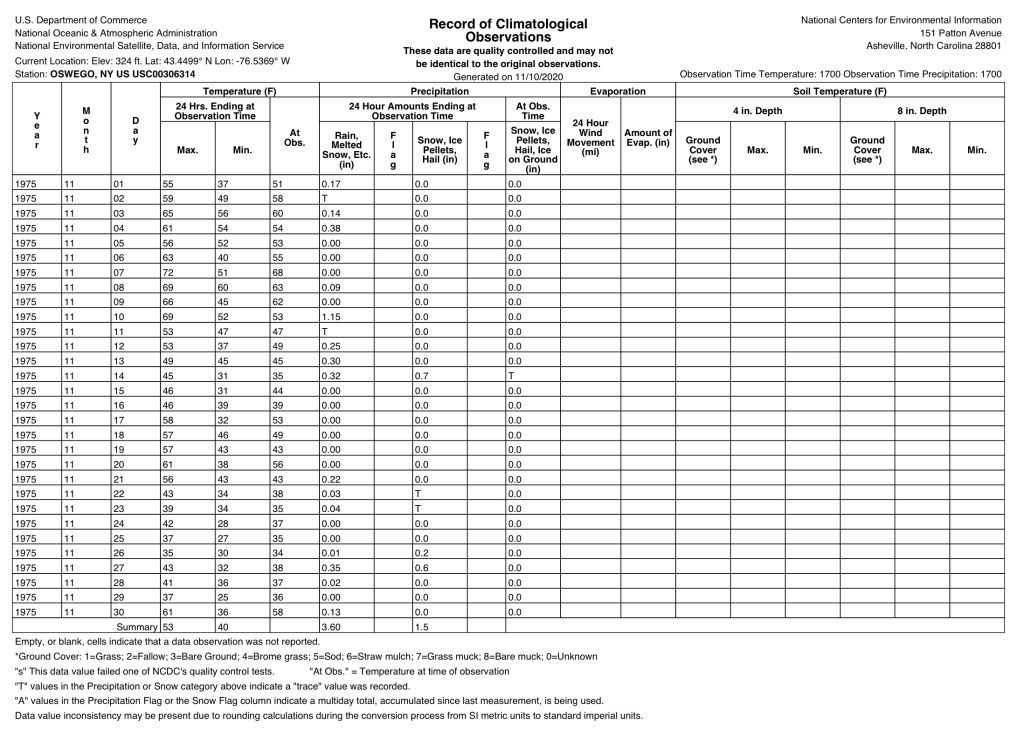
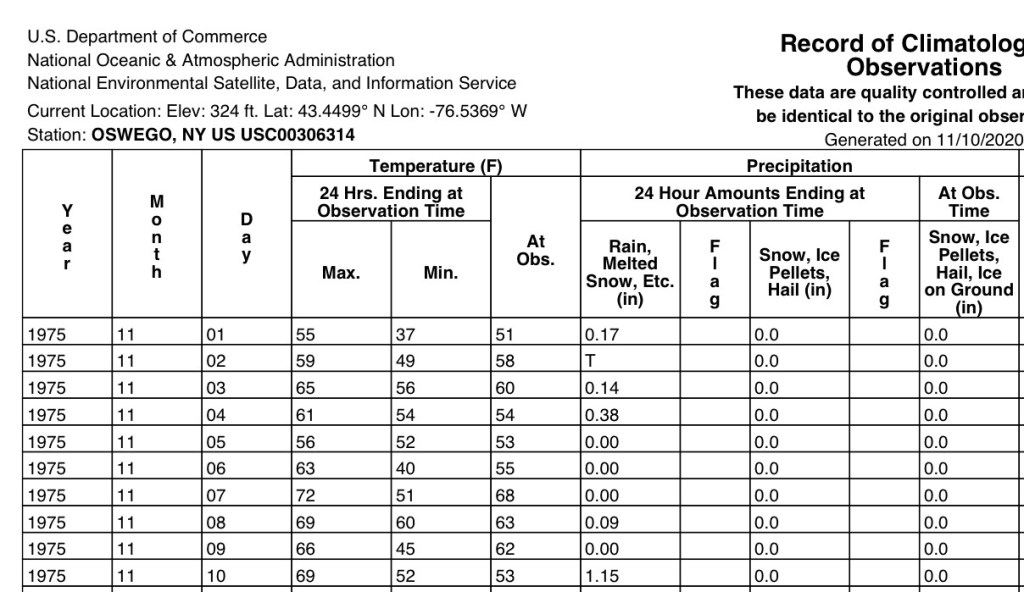
Weather data for Oswego, NY,November 1975.Enlarged Image of Oswego Data for November 1975
The high of 69 F and low of 52 F, quite warm for that time of year, confirms that Oswego, was in the warm sector of the storm system as a warm front passed through the area. The surface and 850 mb analysis shows the winds in Oswego were from the south and not off Lake Ontario. Exact wind speeds can not be ascertained from the charts, but judging from the tight isobars and geopotential isopleths, it was probably brisk and accounts for the warm air advection. Also, 1.15 inches of rain fell during the day. A cold front moved through later that evening.
So The Edmund Fitzgerald Storm did affect SUNY-Oswego on Monday, November 10, 1975.
For several years, I have had a Hanna Products Mail Chime installed on my outdoor mailbox with an indoor receiver. The transmitter is attached to the door of the mailbox. When the door is opened a gravity switch is closed and a signal is sent to the receiver. The receiver sounds an alert and illuminates an LED lamp. The lamp is reset by a momentary contact push-to-close button switch.
I took a receiver apart to see if I could make a simple hack to have a Raspberry Pi sense when the LED lamp was on and then send an email to one of my accounts to indicated the mailbox door had been opened. Another function is to send a signal to a relay module to reset the LED lamp to off.
The project requires some programming skills with Linux and Python, a basic understanding of some electronic components, and some soldering is required. I had my project operating in three short evenings.
Parts List
Hanna Products, Inc. Mail Chime – Amazon $55 Raspberry Pi Model B – Amazon $56 2 1K ohm resisters – Amazon, pack of 100, $6 1 DaFuRui 8Pcs DC 5V 1 Channel Relay Module – Amazon, pack of 8, $13 1 MCP3008 Microchip – Amazon, Pack of 4, $12.50 1 breadboard – Amazon, ELEGOO 3pcs MB-102, $9 Jumper wires – Amazon, Elegoo EL-CP-004, $7
Optional: Raspberry Pi breakout board and ribbon cable A case for the Raspberry Pi.
Tools: Soldering iron and solder Phillips head screwdriver Small flathead screwdriver wire stripper
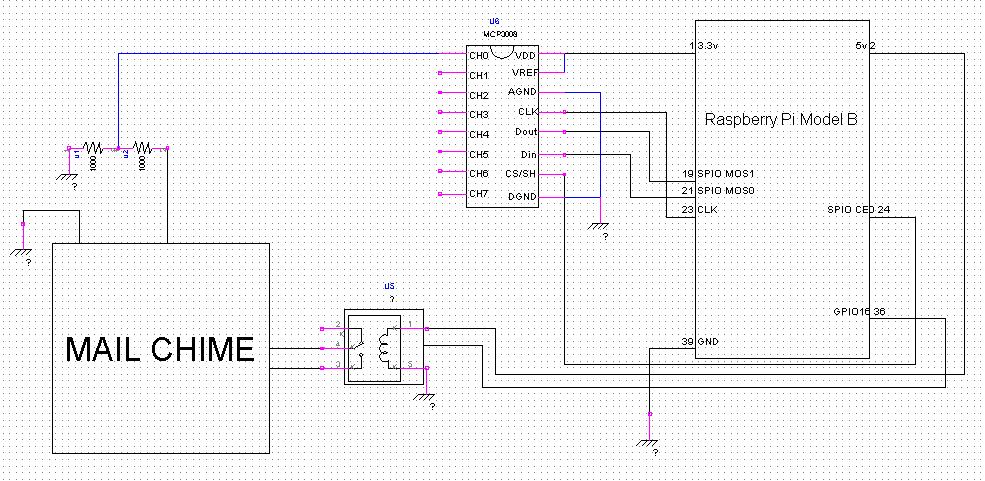
The following is the schematic for the project.
Note the half-moon indentation at one end of the MCP3008 microchip. This will orient the chip to access the correct pins. Also, I used a labeled breakout board for the Raspberry Pi instead of a direct connection.
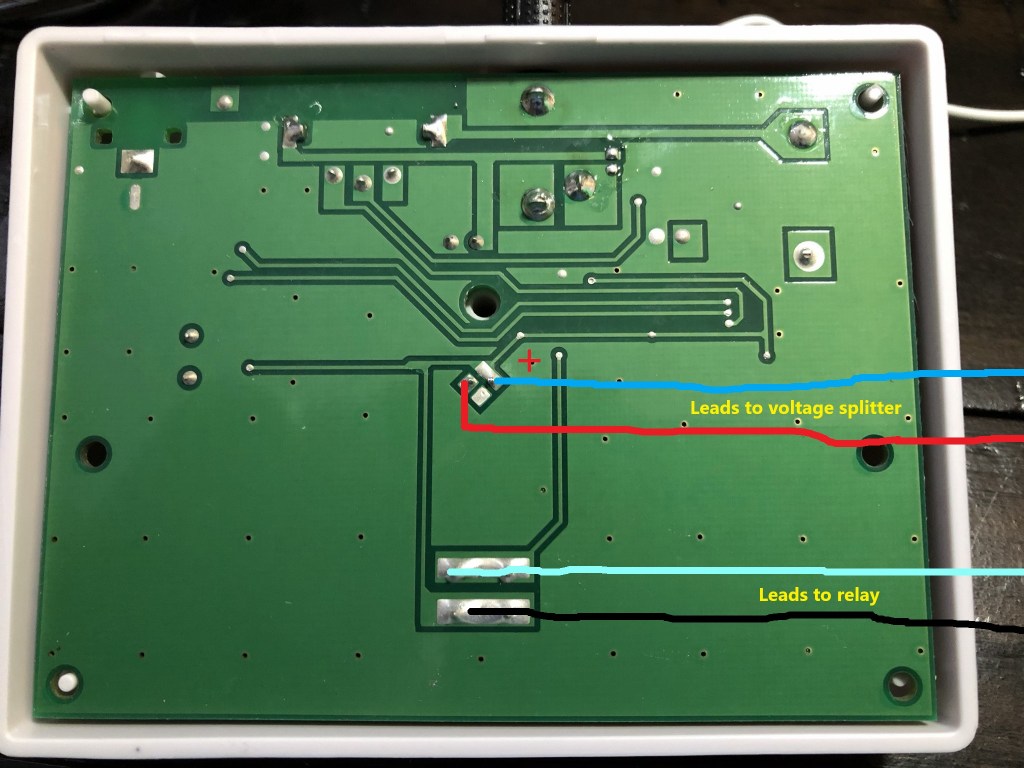
Begin by opening the bottom of the mail chime. One phillips screw holds the bottom panel to the housing. The printed circuit board is not fastened to the housing. Then solder 4 jumper wires to the printed circuit board inside of the disassembled mail chime as shown.
Mail Chime Printed Circuit Board
Then plugin the MCP3008 Microchip, and the 2 1K ohm resistors to the breadboard. Then connect the various jumper wires on the breadboard, and from the breadboard to the Raspberry Pi, the relay module and the mail chime. Use the schematic and photograph as guidance. I used a Raspberry Pi breakout board to easily identify the Raspberry Pi connections.
The resistors act as a voltage splitter to decrease the voltage going to the MCP3008 CH0 pin.
Mail chime printed circuit board connected to the breadboard. Note that a breakout board is being used for the Raspberry Pi, which s connected to a ribbon cable. The breakout board is labeled to identify the pin connections.All components connected.
Use the small flathead screwdriver to connect the jumper wires to the relay module.
Python Scripts
UPDATE: Google no longer permits logins from 3rd party software. I have made a few changes to the mail.py script to set it up for alternate domains. Those changes are in red. Note that the proper name for the SMTP Server Name is required.
Python scripts are placed in the following directory on the Raspberry Pi:
/home/pi/projects/mailbox/
Note that the indented lines in the following Python scripts are indented with tabs, not spaces.
read_volt.py
#!/usr/bin/python3
import spidev, time
import time
import datetime
import os

#Open SPI bus
spi = spidev.SpiDev()
spi.open(0, 0)
spi.max_speed_hz=1000000

#Function to read SPI data from MCP3008 chip
#Channel must be an integer 0-7
def ReadChannel(channel):
     adc = spi.xfer2([1, (8 + channel) << 4, 0])
     data = ((adc[1]&3) << 8) + adc[2]
     return data
#Function to convert data to voltage level
#rounded to specified number of decimal places
def ConvertVolts(data,places):
     volts = (data * 3.3) / float(1023)
     volts = round(volts,places)
     return volts

mySendMail = '/home/pi/projects/mailbox/mail.py'
myResetChime = '/home/pi/projects/mailbox/reset.py'
print ("Check mail was run.")

reading = ReadChannel(0)
voltage = ConvertVolts(reading,2)
print("Reading=%d\tVoltage=%.2f" % (reading, voltage))

#If voltage is greater than or equal to 0.75 V then send an e-#mail

if (voltage >= 0.75):
     os.system(mySendMail)
     now = datetime.datetime.now()
     print("Mailbox was opened at: ")
     print(now.strftime('%H:%M %Y-%m-%d'))
     time.sleep(60)
     os.system(myResetChime)
     print("Mailbox Chime has been reset.")
mail.py
#!/usr/bin/python3
import smtplib
import datetime
MAIL_USER = "user@domain.com"
MAIL_PASS = "password"
now = datetime.datetime.now()
text = 'Your mail box has been opened!!!\n\n'
text = text + 'Time: '+now.strftime("%H:%M:%S %Y-%m-%d")+'\n\n'
sent_from = MAIL_USER
to = ['bill.smith@verizon.net']
subject = 'Mailbox Alert'
body = text
email_text = """\
From: %s
To: %s
Subject: %s
%s
""" % (sent_from, ", ".join(to), subject, body)
try:
server = smtplib.SMTP('<SMTP Server Name>', 587)
server.starttls()
server.login(MAIL_USER, MAIL_PASS)server.sendmail(sent_from, to, email_text)
except Exception as e:
print(e)
finally:
server.quit()
Crontab will run the read_volt.py Python script every 5 minutes. Any output to standard output and standard error will be written to the mailbox.log file for troubleshooting purposes. When the mail chime is triggered by the mailbox door sensor, there will be current to the mail chime LED, which is then detected by the MCP3008 microchip at CH0. This in turn triggers the code to send an email, then after 60 seconds, the relay is actuated to reset the mail chime.
October was 1.0 deg F above normal for temperature. The high for the month was 80.6 deg. F recorded on October 22. The low for the month was 27.7 deg F, recorded on Oct 17. There were 0 days at or above 90 deg F and 1 day at or below 32 deg F. There were 412 heating degree days and 21 cooling degree days.
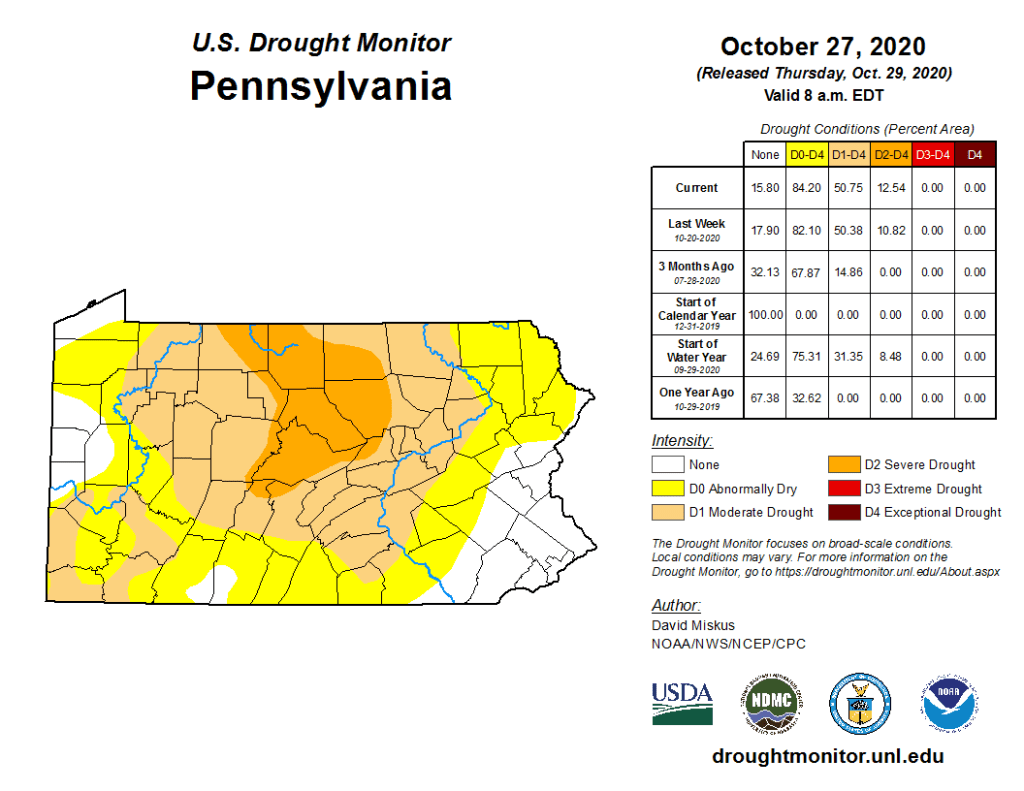
The drought continued into October with below normal precipitation of 2.96 inches of rainfall recorded, which was 0.38 inches below normal. The maximum rainfall in a single day was 1.16 inches recorded on October 29. There were 15 days of rain >.01 in, 8 >.10 in and 1 > 1 in.
September was 0.4 deg F below normal for temperature. The high for the month was 85.9 deg. F recorded on September 8. The low for the month was 32.0 deg F, recorded on September 20. There were 0 days at or above 90 deg F and 1 day at or below 32 deg F. There were 171 heating degree days and 88 cooling degree days.
The drought continued into September with below normal precipitation of 2.61 inches of rainfall recorded, which was 1.37 inches below normal. The maximum rainfall in a single day was 1.34 inches recorded on September 29. There were 5 days of rain >.01 in, 5 >.10 in and 1 > 1 in.
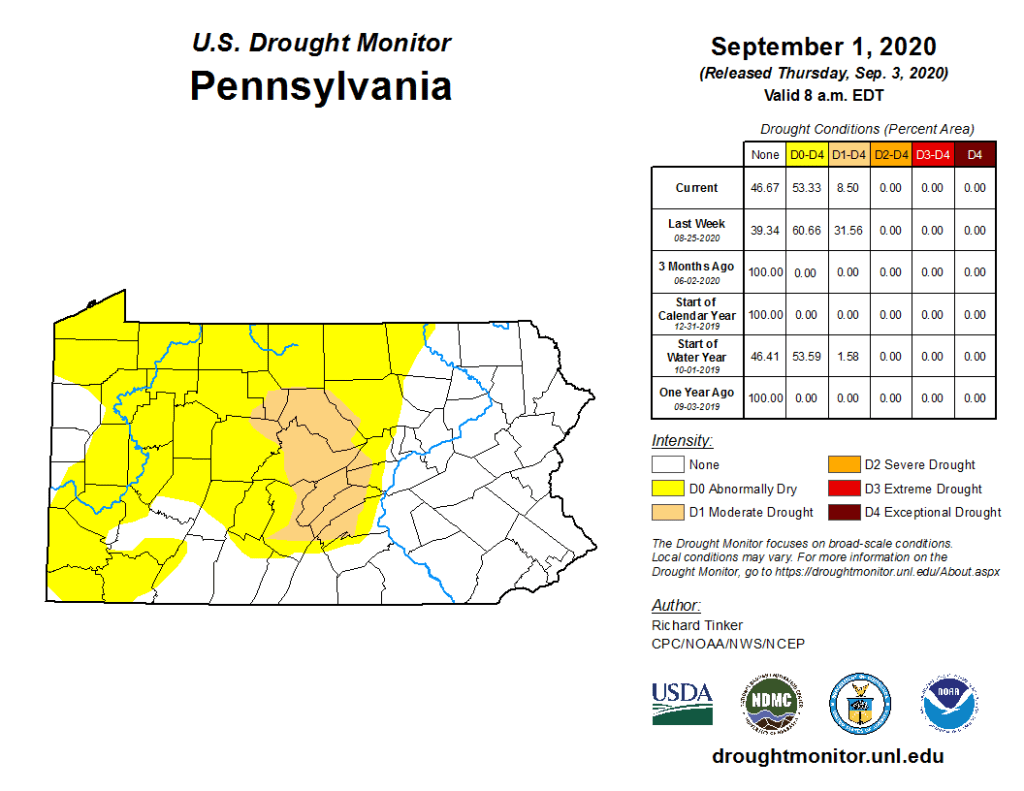
I have recorded 1.89 inches of rainfall since last Thursday. The drought isn’t over yet, but there are signs that it is improving.
Most of Centre County is still experiencing a moderate drought. However, our little corner of the county is now abnormally dry. The outlook for the rest of September indicates equal chances for normal rainfall (about 4 inches on average).
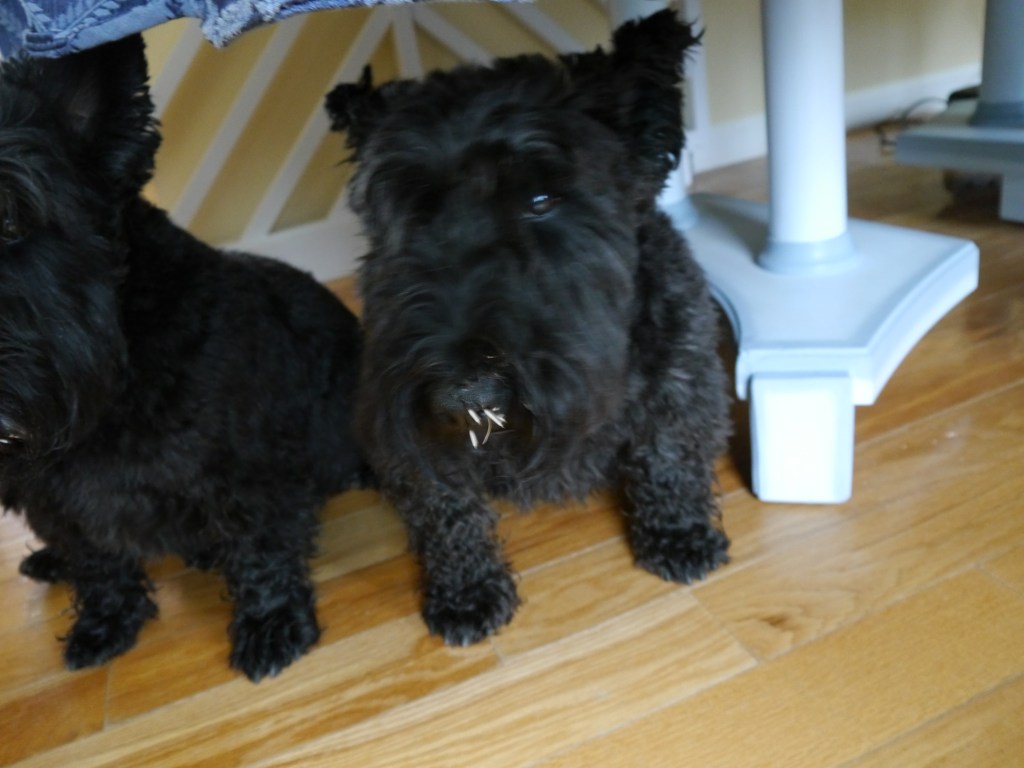
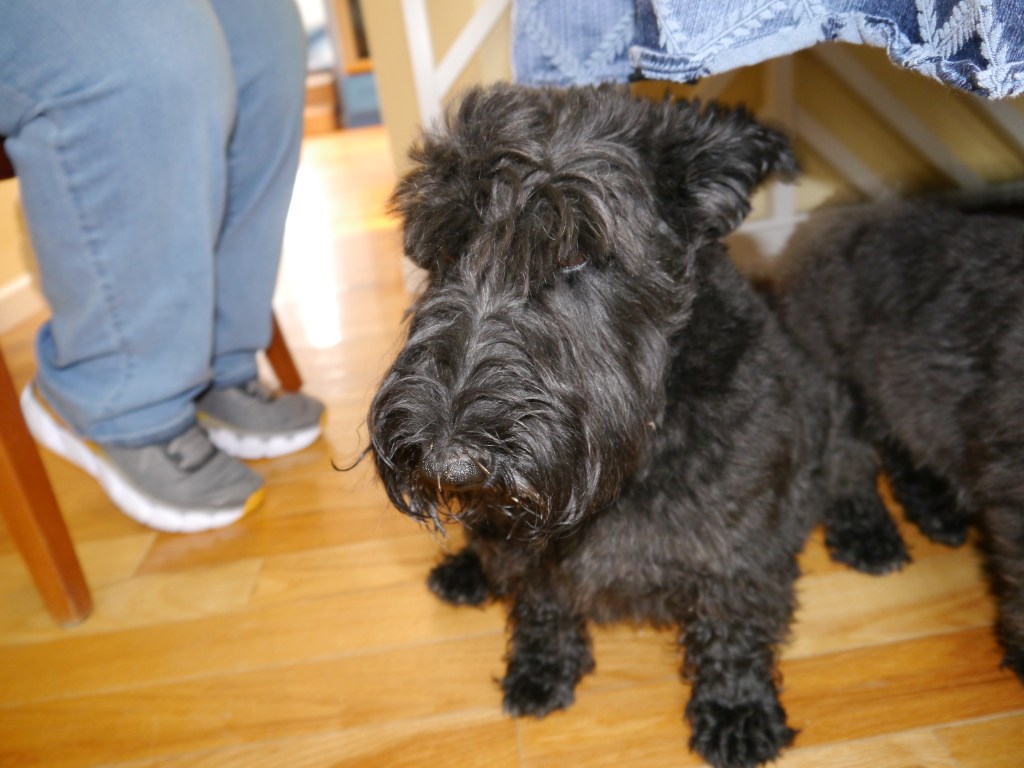
On August 31, 2020, our Scotties, Toby and Tillie, had an unfortunate encounter with a porcupine.
Toby, our male Scotty came in from outside before bedtime and we immediately notices the quills in his snout. He was able to eat and drink so we decided to call the vet the first thing in the morning. He got through the night with no issues.
It wasn’t until the next morning, when I gave Tillie a chin scratch, that I was stabbed by two of the quills that were in her snout. The quills are quite sharp, even on the broken ends.
We were right not to try to remove them on our own since the quills are barbed. The barbs expand when they are exposed to body heat, are quite brittle and there is the risk of driving them deeper into the body.
The vet sedated both Scotties and removed the quills. Tilled had 15 embedded quills and Toby had 12. The vet also confirmed that they were porcupine quills. The dogs each received an analgesic and antibiotic.
Until last night, I had no idea that there are porcupines in our area. They live in a narrow range across central PA which includes our region. They are classified as rodents, are herbivores, mostly nocturnal, and are pests due to the damage they can inflict by chewing tree bark, leather and wood in their search for salt.
August was 2.2 deg F above normal for temperature. The high for the month was 93.1 deg. F recorded on August 22. The low for the month was 47.0 deg F, recorded on August 20. There were 6 days at or above 90 deg F. There were 24 heating degree days and 259 cooling degree days.
August was a below normal month for precipitation with 1.48 inches of rainfall recorded, which was 0.72 inches below normal. The maximum rainfall in a single day was 0.75 inches recorded on August 28. There were 8 days of rain >.01 in, 3 >.10 in and 0 >1 in.